First published on MSDN on Oct 14, 2016
Azure Machine Learning Studio is a drag and drop tool that allows you to run machine learning experiments, train models and deploy web services based on the trained models so you can create web or mobile applications that predict the future based on the past.
If you have an Azure account, you can go to the Azure Portal and create a Machine Learning Workspace to access Azure ML Studio from your account. You will find instructions on how to create a Machine Learning Workspace here.
For this tutorial, I will have you sign in with a guest account, so anyone can explore machine learning!
Visit studio.azureml.net and select Sign up to try Azure Machine Learning Studio for free

You will see three options for exploring Azure Machine Learning Studio. For this tutorial, we can use the free offerings. The Guest workspace does not require any sign in at all. If you choose this option, you can explore the tool, but you will run into some limitations. You won't be able to upload your own datasets, and you won't be able to create a web service based on your trained model. The Free Workspace requires you to log in with a Microsoft account, but it also allows you to save your work, upload your own datasets and create web services. This tutorial requires the Free Workspace. Select that option and sign in with your Microsoft account

After you log in, you will be redirected to Microsoft Azure Machine Learning Studio

The Titanic data set is not a sample data set already loaded in Azure Machine Learning Studio. It is an open data set you can download from various sources on the internet. Different files have slightly different columns and formats. The file used in this example is the train.csv Titanic file from Kaggle (this requires a Kaggle account, but if you are exploring machine learning, you might want to consider creating a Kaggle account to access other interesting datasets or to try some of their competitions). Otherwise, you can find other versions of the Titanic dataset with the power of Bing.
I have renamed the train.csv file to titanic.csv.
One you have downloaded the file, you need to upload it into a dataset in Azure Machine Learning Studio.
Select +NEW at the bottom of the page

Select DATASET | FROM LOCAL FILE


Congratulations! You now have a dataset loaded into Microsoft Azure Machine Learning Studio!
There are several built-in experiments you can explore to discover the capabilities of the tool, but we are going to create our own from scratch.
Select +NEW from the bottom of the screen and select experiments.

Select EXPERIMENT | Blank Experiment . The other tiles listed allow you to explore the pre-built experiments provided with the tool.

You will be redirected to the landing page for your experiment.
Change the title at the top of the experiment to read “Titanic Survival". When you change the title text, you change the name of your experiment.

Expand Saved Datasets | My Datasets and drag your Titanic dataset to the workspace. You will also see Samples listed under Saved Datasets. There are datasets provided with the tool you can use to explore different types of machine learning experiments.

Right click the dataset on your worksheet and select dataset | visualize from the pop-up menu, explore the dataset by clicking on different columns. It’s essential in Machine Learning to be familiar with your data. This dataset provides information about passengers on the Titanic and whether they survived. We are going to use this information to predict if a fictional passenger (you? your friends?) would have survived the sinking of the Titanic!

Here's a summary of the columns in the dataset
Type “ select columns ” into the search bar and drag the Select Columns in Dataset task to the workspace. Connect the output of your dataset to the Select Columns in Dataset task input.

The Select Columns in Dataset task allows you to specify which columns in the data set you think are significant to a prediction. You need to look at the data in the dataset and decide which columns represent data that you think will affect whether a passenger would survive the sinking of the Titanic. You also need to select the column you want to predict. In this case, we are going to try to predict the value of survived. This is a 0/1 column that indicates whether a passenger survived. A zero indicates the passenger did not survive, a 1 indicated the passenger did survive.
Click on the Select Columns in Dataset task. On the properties pane on the right hand side, select Launch column selector

Select the columns you think affect whether a passenger would survive as well as the column we want to predict: survived. In the following screenshot, I selected Pclass (1 st class, 2 nd class, …) , Sex (Male or Female) , Age, and SibSp (number of siblings or spouses travelling with the passenger). I selected these columns because I think these factors will influence whether a passenger would have survived. I can always go back and change these later if I am not happy with the accuracy of my trained model. I also selected Survived because that is the value I want to predict. You might select more, or less columns.

Type “ split ” into the search bar and drag the Split Data task to the workspace. Connect the output of Select Columns in Dataset task to the input of the Split Data task.

The Split Data task allows us to divide up our data. We need some of the data to try and find patterns and we need to save some of the data to test if the model we create successfully makes predictions. Traditionally, you will split the data 80/20 or 70/30. I am going to use an 80/20 split so 80% of my data will be sent to output 1 so I can analyze it for patterns. 20% of my data will be sent to output 2 so I can use it to test my trained model.
Click on the Split Data task to bring up properties and specify .8 as the Fraction of rows in the first output

Now that we have our data ready to analyze, it's time to train our model.
Type “ train model ” into the search bar. Drag the Train Model task to the workspace. Connect the first output (the one on the left) of the Split Data task to the rightmost input of the Train Model task. This will take the 80% of our data we split off for training and use it to train/teach our model to make predictions.

Now we need to tell the Train Model task which column we are trying to predict with our model. In our case, we are trying to predict the value of the column Survived, which indicates if a passenger survived.
Click on the Train Model task. In the properties window, select Launch Column Selector and select the column Survived .

If you are a data scientist who creates their own algorithms, you could now import your own R code to try and analyze the patterns. However, we can also use one of the existing built-in algorithms. Type “ two - class ” into the search bar. You will see a number of different classification algorithms listed. Each of the two-class algorithms is designed to predict a yes/no outcome for a column. Each algorithm has its advantages and disadvantages. You can learn more about the different algorithms provided with the tool in the Classification Documentation . I have selected Two-Class Boosted Decision Tree and dragged it to the workspace. You can select any of the Two-Class algorithms.
Connect the output of the Two-Class Boosted Decision Tree task to the leftmost input of the train model task.

After the model is trained, we need to see how well it predicts survival, so we need to score the model by having it test against the 20% of the data we split to our second output using the Split Data task.
Type “ score ” into the search bar and drag the Score Model task to the workspace. Connect the output of Train Model to the left input of the Score model task. Connect the right output of the Split Data task to the right input of the Score Model task as shown in the following screenshot.

Now, connect the second output from the Split Data Task to the rightmost input of the Score Model task.
The Score Model task will take the trained model from our Train Model task and run it against the test data we put aside with the Split Data task. It will compare the survival predicted by our model to the actual survival of known passengers.

Now we need to get an evaluation of how well our model scored during the testing.
Type “ evaluate ” into the search bar and drag the Evaluate Model task to the bottom of the workspace. Connect the output of the Score model task to the left input of the Evaluate Model task.

You are now ready to run your experiment!
Press Run on the bottom toolbar. You will see green checkmarks appear on each task as it completes.

When the entire experiment is completed, right click on the evaluate model task and select Evaluation results | Visualize to see how well your model predicted survival.
In my visualization, I see the following curve
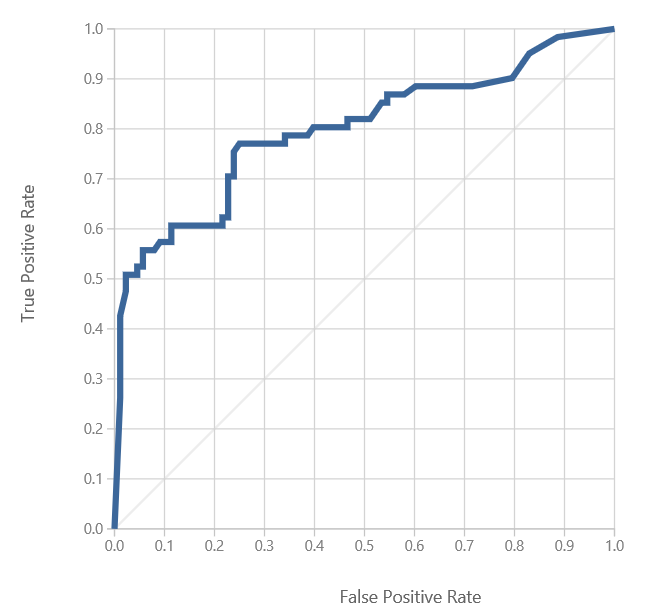
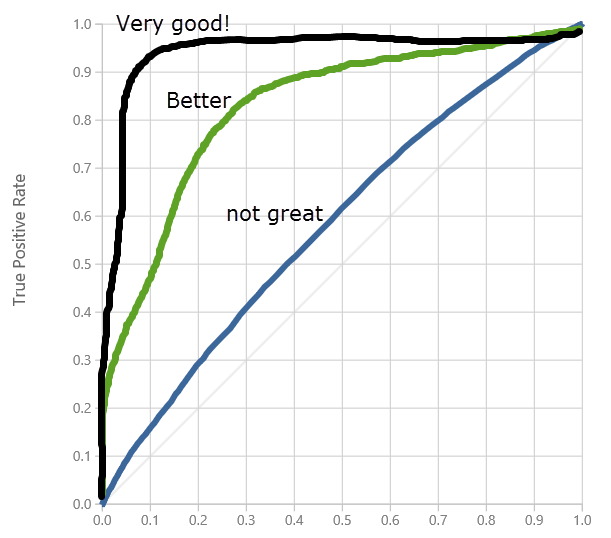
The greater the area under the curve, the better your model is predicting correct results.
If you scroll down, you see the number of false and true positive and negative predictions and the total Area Under the Curve (AUC). The closer AUC is to 1.0 the better your results.
You want higher values for True positives and True negatives, you want low values for False Positives and False negatives.

You can see from the results above that my model is getting okay – but not amazing – accuracy . Still, it's accurate enough to have a little fun entering a fictional passenger to see if they live!
Having a well-trained model isn't much use if you don't have a way to use it! We want to use our model to try and predict outcomes for new data. We do this by deploying our model as a web service. You pass new data to the web service and it returns a predicted outcome. In our case, we will deploy a web service, give it information on a fictional passenger, and it will predict whether our fictional passenger survives.
To create a web service, select SET UP WEB SERVICE | Predictive Web Service from the toolbar at the bottom of your page (Tip: if you haven't done so already, now is also a good time to save your work) before you create the web service. Tip: If Predictive Web Service is greyed out, run the experiment again and it should be enabled.

A new tab will be added to your project. You now have a Training experiment (your original experiment) and a new Predictive experiment. The predictive experiment is your web service.
The predictive model doesn’t have as many components as your original experiment, and you will notice a few differences:

Delete the connection from the Web input to Select Columns in Dataset task and redraw the connection from the Web input to the Score Model task. If you leave the web input connected to project columns, the web service will prompt you for values for all the data columns even though we don’t use all columns to make our prediction. If you have the web input connected to the score model directly, the web service will only expect the data columns we selected in our Select Columns in DataSet task, which we determined are relevant for making predictions. (Tip: If you are using a Mac and have trouble deleting the connection, try refreshing the browser, for some reason Safari occasionally needs refreshing when working with experiments). For more details on how to do this conversion, see Convert a Machine Learning training experiment to a predictive experiment

Deploy the predictive experiment as a web service.
Now that the predictive experiment has been sufficiently prepared, you can deploy it as an Azure web service. Using the web service, users can send data to your model and the model will return its predictions.
To deploy your predictive experiment, click Run at the bottom of the experiment canvas

After it runs successfully, select Deploy Web Service . The web service is set up and you are placed in the web service dashboard.

Congratulations you now have a web service for your trained model.

Select the Test button in the web service dashboard. A dialog pops up to ask you for the input data for the service. These are the columns expected by the scoring experiment. Enter a set of data and then select OK . The results generated by the web service are displayed at the bottom of the dashboard.

You will be presented with a window where you can enter values for a fictional passenger. You may have to scroll down to see all the fields you need to enter. Here are the fields I am required to enter for my experiment.

You may have different fields depending on the columns you selected to train your model and depending on the task connected to your web service input.
When you select the checkbox to send your data to the web service, you will see your results returned at the bottom of the screen. Select details to see the full record passed back from the web service.

The last two columns passed back are Scored Labels and Scored Probabilities. Scored Label is the value predicted for my passenger. My passenger gets a 1, which means they would have likely survived! The Scored Probability is the likelihood of the Scored Label being correct. 99.9% is pretty good confidence! Of course, if you saw the movie, you know that first class passengers and women were more likely to live. Experiment with different data and see how that changes your results.
Congratulations you can now predict if fictional passengers would have survived the sinking of the Titanic.
Wondering how you would call this web service from your code? Select the Request Response or Batch Execution links on the Web Service home page. You will find code snippets showing you how to call the web service from Python or C# code. You do need to replace the API key with the API Key of your web service (located on the web service home page) and you will need to change the values passed to the web service in the sample code. The free tier of Azure ML Studio will not allow you to call the web service, so you will need some sort of Azure trial if you want to start calling your web service from your code. You can sign up for a one month free trial of Microsoft Azure . You can continue to learn and explore by loading different datasets, running models, and making predictions using the Test utility with the free workspace inside Azure ML Studio.
Explore other Azure features and download software tools to help you develop amazing projects for free as a student by signing up at Microsoft Imagine . Also, be sure to check out some of our great cloud development courses over on the Microsoft Virtual Academy.
And if you haven’t already, be sure to create a Microsoft Imagine student profile , giving you access to developer tools, online training, developer competitions and the bi-monthly Microsoft Imagine newsletter.
Happy coding!
Microsoft Imagine, anywhere, anytime:
Launching Azure Machine Learning Studio
Azure Machine Learning Studio is a drag and drop tool that allows you to run machine learning experiments, train models and deploy web services based on the trained models so you can create web or mobile applications that predict the future based on the past.
If you have an Azure account, you can go to the Azure Portal and create a Machine Learning Workspace to access Azure ML Studio from your account. You will find instructions on how to create a Machine Learning Workspace here.
For this tutorial, I will have you sign in with a guest account, so anyone can explore machine learning!
Visit studio.azureml.net and select Sign up to try Azure Machine Learning Studio for free
You will see three options for exploring Azure Machine Learning Studio. For this tutorial, we can use the free offerings. The Guest workspace does not require any sign in at all. If you choose this option, you can explore the tool, but you will run into some limitations. You won't be able to upload your own datasets, and you won't be able to create a web service based on your trained model. The Free Workspace requires you to log in with a Microsoft account, but it also allows you to save your work, upload your own datasets and create web services. This tutorial requires the Free Workspace. Select that option and sign in with your Microsoft account
After you log in, you will be redirected to Microsoft Azure Machine Learning Studio
Loading the Titanic data
The Titanic data set is not a sample data set already loaded in Azure Machine Learning Studio. It is an open data set you can download from various sources on the internet. Different files have slightly different columns and formats. The file used in this example is the train.csv Titanic file from Kaggle (this requires a Kaggle account, but if you are exploring machine learning, you might want to consider creating a Kaggle account to access other interesting datasets or to try some of their competitions). Otherwise, you can find other versions of the Titanic dataset with the power of Bing.
I have renamed the train.csv file to titanic.csv.
One you have downloaded the file, you need to upload it into a dataset in Azure Machine Learning Studio.
Select +NEW at the bottom of the page
Select DATASET | FROM LOCAL FILE
- Select the data file you downloaded containing the Titanic data.
- Give your data set a name
- The file I downloaded from Kaggle has a header row, so I have selected the data set type Generic CSV File with a header (.csv)
- Enter a description for the dataset
- Select the checkbox to continue
Congratulations! You now have a dataset loaded into Microsoft Azure Machine Learning Studio!
Creating your first experiment
There are several built-in experiments you can explore to discover the capabilities of the tool, but we are going to create our own from scratch.
Select +NEW from the bottom of the screen and select experiments.
Select EXPERIMENT | Blank Experiment . The other tiles listed allow you to explore the pre-built experiments provided with the tool.
You will be redirected to the landing page for your experiment.
Change the title at the top of the experiment to read “Titanic Survival". When you change the title text, you change the name of your experiment.
Expand Saved Datasets | My Datasets and drag your Titanic dataset to the workspace. You will also see Samples listed under Saved Datasets. There are datasets provided with the tool you can use to explore different types of machine learning experiments.
Right click the dataset on your worksheet and select dataset | visualize from the pop-up menu, explore the dataset by clicking on different columns. It’s essential in Machine Learning to be familiar with your data. This dataset provides information about passengers on the Titanic and whether they survived. We are going to use this information to predict if a fictional passenger (you? your friends?) would have survived the sinking of the Titanic!
Here's a summary of the columns in the dataset
- PassengerId is a unique identifier assigned to each passenger
- Survived is a flag that indicates if a passenger survived. 0 = No, 1 = Yes
- Pclass is the passenger class. 1 = 1 st class, 2 = 2 nd class, 3 = 3 rd class)
- Name is the name of the passenger
- Sex indicates the gender of the passenger
- Age indicates the age of the passenger
- Sibsp indicates the number of siblings or spouses aboard the Titanic with the passenger
- Parch indicates the number of parents or children aboard
- Ticket indicates the ticket number issued to the passenger
- Fare indicates the amount of money spent on their ticket
- Cabin indicates the cabin occupied by the passenger
- Embarked indicates the port where the passenger embarked. C = Cherbourg, Q = Queenstown, S = Southampton)
Selecting Features from your dataset
Type “ select columns ” into the search bar and drag the Select Columns in Dataset task to the workspace. Connect the output of your dataset to the Select Columns in Dataset task input.
The Select Columns in Dataset task allows you to specify which columns in the data set you think are significant to a prediction. You need to look at the data in the dataset and decide which columns represent data that you think will affect whether a passenger would survive the sinking of the Titanic. You also need to select the column you want to predict. In this case, we are going to try to predict the value of survived. This is a 0/1 column that indicates whether a passenger survived. A zero indicates the passenger did not survive, a 1 indicated the passenger did survive.
Click on the Select Columns in Dataset task. On the properties pane on the right hand side, select Launch column selector
Select the columns you think affect whether a passenger would survive as well as the column we want to predict: survived. In the following screenshot, I selected Pclass (1 st class, 2 nd class, …) , Sex (Male or Female) , Age, and SibSp (number of siblings or spouses travelling with the passenger). I selected these columns because I think these factors will influence whether a passenger would have survived. I can always go back and change these later if I am not happy with the accuracy of my trained model. I also selected Survived because that is the value I want to predict. You might select more, or less columns.
Putting aside data for testing
Type “ split ” into the search bar and drag the Split Data task to the workspace. Connect the output of Select Columns in Dataset task to the input of the Split Data task.
The Split Data task allows us to divide up our data. We need some of the data to try and find patterns and we need to save some of the data to test if the model we create successfully makes predictions. Traditionally, you will split the data 80/20 or 70/30. I am going to use an 80/20 split so 80% of my data will be sent to output 1 so I can analyze it for patterns. 20% of my data will be sent to output 2 so I can use it to test my trained model.
Click on the Split Data task to bring up properties and specify .8 as the Fraction of rows in the first output
Training your model
Now that we have our data ready to analyze, it's time to train our model.
Type “ train model ” into the search bar. Drag the Train Model task to the workspace. Connect the first output (the one on the left) of the Split Data task to the rightmost input of the Train Model task. This will take the 80% of our data we split off for training and use it to train/teach our model to make predictions.
Now we need to tell the Train Model task which column we are trying to predict with our model. In our case, we are trying to predict the value of the column Survived, which indicates if a passenger survived.
Click on the Train Model task. In the properties window, select Launch Column Selector and select the column Survived .
If you are a data scientist who creates their own algorithms, you could now import your own R code to try and analyze the patterns. However, we can also use one of the existing built-in algorithms. Type “ two - class ” into the search bar. You will see a number of different classification algorithms listed. Each of the two-class algorithms is designed to predict a yes/no outcome for a column. Each algorithm has its advantages and disadvantages. You can learn more about the different algorithms provided with the tool in the Classification Documentation . I have selected Two-Class Boosted Decision Tree and dragged it to the workspace. You can select any of the Two-Class algorithms.
Connect the output of the Two-Class Boosted Decision Tree task to the leftmost input of the train model task.
Testing your model
After the model is trained, we need to see how well it predicts survival, so we need to score the model by having it test against the 20% of the data we split to our second output using the Split Data task.
Type “ score ” into the search bar and drag the Score Model task to the workspace. Connect the output of Train Model to the left input of the Score model task. Connect the right output of the Split Data task to the right input of the Score Model task as shown in the following screenshot.
Now, connect the second output from the Split Data Task to the rightmost input of the Score Model task.
The Score Model task will take the trained model from our Train Model task and run it against the test data we put aside with the Split Data task. It will compare the survival predicted by our model to the actual survival of known passengers.
Now we need to get an evaluation of how well our model scored during the testing.
Type “ evaluate ” into the search bar and drag the Evaluate Model task to the bottom of the workspace. Connect the output of the Score model task to the left input of the Evaluate Model task.
You are now ready to run your experiment!
Running your experiment
Press Run on the bottom toolbar. You will see green checkmarks appear on each task as it completes.
When the entire experiment is completed, right click on the evaluate model task and select Evaluation results | Visualize to see how well your model predicted survival.
How to interpret your results
In my visualization, I see the following curve
The greater the area under the curve, the better your model is predicting correct results.
If you scroll down, you see the number of false and true positive and negative predictions and the total Area Under the Curve (AUC). The closer AUC is to 1.0 the better your results.
- True positives are how often your model correctly predicted a passenger would survive (Survived = 1)
- False positives are how often your model predicted a passenger would survive, when the passenger did not survive (your model predicted incorrectly)
- True negatives indicate how often your model correctly predicted a passenger would not survive (Survived = 0)
- False negatives indicate how often your model predicted a passenger would not survive, when in fact the passenger did survive (your model predicted incorrectly)
You want higher values for True positives and True negatives, you want low values for False Positives and False negatives.
You can see from the results above that my model is getting okay – but not amazing – accuracy . Still, it's accurate enough to have a little fun entering a fictional passenger to see if they live!
Creating a web service
Having a well-trained model isn't much use if you don't have a way to use it! We want to use our model to try and predict outcomes for new data. We do this by deploying our model as a web service. You pass new data to the web service and it returns a predicted outcome. In our case, we will deploy a web service, give it information on a fictional passenger, and it will predict whether our fictional passenger survives.
To create a web service, select SET UP WEB SERVICE | Predictive Web Service from the toolbar at the bottom of your page (Tip: if you haven't done so already, now is also a good time to save your work) before you create the web service. Tip: If Predictive Web Service is greyed out, run the experiment again and it should be enabled.
A new tab will be added to your project. You now have a Training experiment (your original experiment) and a new Predictive experiment. The predictive experiment is your web service.
The predictive model doesn’t have as many components as your original experiment, and you will notice a few differences:
- You don’t need the data set because when someone calls the web services they will pass in the data to use for the prediction.
- You still need to identify which columns will be used for predictions if you pass in a full record of data.
- Your two-class algorithm and Train Model tasks have now become a single trained model which will be used to analyze the data passed in and make a prediction
- We don’t need to evaluate the model to test its accuracy. We just want to call the model we created. All we need is a Score model to return a result from our trained model.
- Two new tasks are added to indicate how the data from the web service is input to the experiment, and how the data from the experiment is returned to the web service.
Delete the connection from the Web input to Select Columns in Dataset task and redraw the connection from the Web input to the Score Model task. If you leave the web input connected to project columns, the web service will prompt you for values for all the data columns even though we don’t use all columns to make our prediction. If you have the web input connected to the score model directly, the web service will only expect the data columns we selected in our Select Columns in DataSet task, which we determined are relevant for making predictions. (Tip: If you are using a Mac and have trouble deleting the connection, try refreshing the browser, for some reason Safari occasionally needs refreshing when working with experiments). For more details on how to do this conversion, see Convert a Machine Learning training experiment to a predictive experiment
Deploy the predictive experiment as a web service.
Now that the predictive experiment has been sufficiently prepared, you can deploy it as an Azure web service. Using the web service, users can send data to your model and the model will return its predictions.
To deploy your predictive experiment, click Run at the bottom of the experiment canvas
After it runs successfully, select Deploy Web Service . The web service is set up and you are placed in the web service dashboard.
Congratulations you now have a web service for your trained model.
Testing the web service
Select the Test button in the web service dashboard. A dialog pops up to ask you for the input data for the service. These are the columns expected by the scoring experiment. Enter a set of data and then select OK . The results generated by the web service are displayed at the bottom of the dashboard.
You will be presented with a window where you can enter values for a fictional passenger. You may have to scroll down to see all the fields you need to enter. Here are the fields I am required to enter for my experiment.
- Survived – leave as 0, that is the value the web service will predict
- PClass – Enter 1,2 or 3 for first, second or third class
- Sex – Enter male or female (lowercase letters)
- Age – Enter a numeric age
- SIBSP – Enter the number of siblings and spouses travelling with the passenger
You may have different fields depending on the columns you selected to train your model and depending on the task connected to your web service input.
When you select the checkbox to send your data to the web service, you will see your results returned at the bottom of the screen. Select details to see the full record passed back from the web service.
The last two columns passed back are Scored Labels and Scored Probabilities. Scored Label is the value predicted for my passenger. My passenger gets a 1, which means they would have likely survived! The Scored Probability is the likelihood of the Scored Label being correct. 99.9% is pretty good confidence! Of course, if you saw the movie, you know that first class passengers and women were more likely to live. Experiment with different data and see how that changes your results.
Congratulations you can now predict if fictional passengers would have survived the sinking of the Titanic.
Wondering how you would call this web service from your code? Select the Request Response or Batch Execution links on the Web Service home page. You will find code snippets showing you how to call the web service from Python or C# code. You do need to replace the API key with the API Key of your web service (located on the web service home page) and you will need to change the values passed to the web service in the sample code. The free tier of Azure ML Studio will not allow you to call the web service, so you will need some sort of Azure trial if you want to start calling your web service from your code. You can sign up for a one month free trial of Microsoft Azure . You can continue to learn and explore by loading different datasets, running models, and making predictions using the Test utility with the free workspace inside Azure ML Studio.
Explore other Azure features and download software tools to help you develop amazing projects for free as a student by signing up at Microsoft Imagine . Also, be sure to check out some of our great cloud development courses over on the Microsoft Virtual Academy.
And if you haven’t already, be sure to create a Microsoft Imagine student profile , giving you access to developer tools, online training, developer competitions and the bi-monthly Microsoft Imagine newsletter.
Happy coding!
Microsoft Imagine, anywhere, anytime:
- Follow us on Twitter , Facebook , Instagram and YouTube .
- Subscribe to our blog to meet students just like you who are changing the world with their exciting new technology. Plus, stay on top of all the new products and offerings for students.
- Head on over to Microsoft Imagine where, if you haven’t already, you can create a Microsoft Imagine student profile, giving you access to developer tools, online training, developer competitions and the bi-monthly Microsoft Imagine newsletter.
Updated Jan 08, 2019
Version 2.0StudentDeveloperTeam
Bronze Contributor
Joined January 04, 2019
Student Developer Blog
Connecting aspiring student developers with tools, resources and experiences to turn innovative ideas into reality.