We already discussed when an execution plan is created and how long it is valid. We also had a look on the factors which have an influence on the execution plan. SAP almost always executes parameterized statements on SQL Server. For details see:
http://blogs.msdn.com/saponsqlserver/archive/2009/02/09/sql-execution-plans-part-1-sql-statement-execution-on-an-sap-system.aspx
http://blogs.msdn.com/saponsqlserver/archive/2009/02/22/sql-execution-plans-part-2-sql-compilation.aspx
Figuring out the execution plan of a long running SQL statement in an SAP system is much more complicated than one would expect in the first instance.
There are several places in an SAP NetWeaver system, where you can see SQL Server execution plans. The most famous place is the SAP SQL trace. Since this trace is started using SAP transaction ST05 it is often simply called ST05 trace. Every single ABAP programmer knows how to use this trace and to see the execution plan of a traced SQL statement. However, almost no one is aware of the fact, that you will always get an estimated execution plan based on the parameters submitted to the queries while the traces was running. The actual used execution plan is only visible in the DBA Cockpit (SAP transaction DBACOCKPIT). You can either see the actual execution plan of a currently running request or an execution plan which is stored in the SQL Server statement cache. In the DBA Cockpit you can also start a SQL Profiler trace (including the execution plan). Due to the performance overhead of a SQL Profiler trace we typically do not recommend this.
The user interface of the SAP database monitor has changed a lot over the years. In the following we will have a closer look at SAP transaction DBACOCKPIT, which is available in NetWeaver 700 basis support package 13 and newer SAP releases. However, the concepts described here also apply for older SAP releases and for transaction ST04 (the predecessor of DBACOCKPIT).
SAP SQL trace (ST05 trace)
A ST05 trace can be activated per SAP instance (application server), SAP user and database table. The trace is running on the SAP application server and storing all executed SQL statements in a file. It contains the SQL statement, the actual used parameters, the number of rows returned and the time needed to run the statement in microseconds. The measured time includes all kind of waits, such as I/O, blocking database locks and network traffic. The ST05 trace is very popular because the user interface is identical for all database platforms supported by SAP (SQL Server, Oracle, DB2, Informix, MaxDB). An ABAP programmer can perform a ST05 trace without having a deeper knowledge of the underlying database system. However, in order to check and understand a SQL Server execution plan you actually need to get a better idea how ST05 works for SQL Server.
Let’s have a closer look how a ST05 trace looks like. One great feature of a ST05 trace is the summarization function. You can easily figure out the SQL statements with the highest overall time, time per execution or time per row returned:

When pressing the “Explain” button an estimated execution plan is displayed. Therefore SAP creates temporarily a stored procedure for the traced SQL statement, using a SP name starting with sap_XPL. Then the stored procedure is executed with the traced parameters, using a database session with option SET SHOWPLAN_XML ON. As a result, SQL Server returns a XML execution plan for the query. This estimated execution plan is not necessarily identical to the execution plan used by SQL Server when the traced SQL statement was originally executed. It is the plan SQL Server would create now, considering the used parameters and the actual index statistics.

The XML execution plan is parsed by SAP in order to create the “Explain Tree” as you can see in the screenshot above. This kind of display is often better readable, since you can collapse branches of the tree individually. Alternatively you can display the execution plan as plain text by changing to the “Text Explain” tab. By pressing the “XML” button the original XML explain is opened using Internet Explorer (or the application which is associated with the .xml extension). You can even display the execution plan graphically using Management Studio. When pressing the “SSMS” button, SAP stores the XML plan as a file with the extension .sqlplan and opens it with S QL S erver M anagement S tudio which is installed on your computer:

“SQL statements” in DBA Cockpit
Using the SAP transaction DBACOCKPIT you can easily access the runtime statistics of all parameterized SQL statements and the currently cached execution plan. SAP retrieves this information from SQL Server’s Dynamic Management View (DMV)”sys.dm_exec_query_stats”.
When opening the screen “SQL statements” in DBA Cockpit you will get a list with the 300 most expensive SQL statements regarding the total elapsed time. Changing the number of rows or the criteria results in re-reading the list from SQL Server’s DMVs. Therefore a specific SQL statement may not be in the result list any more after changing the criteria from “Total elapsed time” to “Average Logical Reads”.

DBA Cockpit can use the standard list functionality of SAP. When clicking on the icons in the list above, you can sort by any column or apply an additional filter on the current list (without re-reading the data from SQL Server). After sorting and filtering the screen may look like this:

By pressing the “Explain” button the XML execution plan is read from the SQL Server statement cache (procedure cache). This is the execution plan which is currently in use. If you want to know how long it has been in use, then you can simply look at the last column of the list. This column called “Comp date” contains date and time of the plan creation (compilation). The SQL Server statement cache is typically large enough to keep most execution plans for days or weeks.

The user interface in SAP for the SQL explain is the same in ST05 and DBA cockpit. Per default the execution plan is displayed as an explain tree. You can use Internet Explorer to see it as plain XML or use SQL Management Studio to get a graphical view of it. The used explain method is explicitly mentioned. When clicking on the tab “SQL Code” you will get the SQL statement and the parameters which were used during the compilation. These parameters are extracted by SAP from the XML execution plan.

“SAP SQL Statistics” in DBA Cockpit
In SQL Server 2005 and newer releases you can easily figure out expensive SQL queries. They can be queried from the SQL Server statement cache using DMVs. In older SQL Server releases there was no feature like this. Therefore SAP implemented its own statement cache in the SAP database interface for OLEDB. The cache is used to collect statement execution statistics on the application server. In DBA Cockpit you can see the SQL Server statement cache in “SQL Statements” and the SAP statement cache in “SAP SQL Statistics”. Since it is not needed any more, the SAP statement cache was removed for SQL Server 2008 and newer releases. Therefore “SAP SQL Statistics” is grayed-out in DBA Cockpit for these SQL releases.

Each SAP instance (application server) has its own statement cache, containing statistical information like the number of executions and min/max/average execution time per query. Since this data is measured by SAP, it cannot include the number of physical/logical reads per query or the used execution plan. The size of the SAP statement cache is configurable, but has a fixed size. Therefore a query may be flushed out of the SAP statement cache. The statement caches of the SAP instances are independent from each other and from the statement cache in SQL Server. Therefore a particular query may be found in the SAP statement cache and not in the SQL Server statement cache, or visa verse.
You can reset the “SAP SQL Statistics” per SAP instance. This is useful for tracing a long running SAP batch jobs without the overhead of a SQL Profiler trace. Unlike the SQL Server 2005 DMVs, it contains the number of rows selected per statement.
The “SAP SQL Statistics” has the same user interface as in “SQL Statements” and ST05 to display the execution plan of a query. However, you should be aware that this is an estimated execution plan. It is created using the parameters stored in the SAP statement cache of the current SAP instance. The SAP statement cache contains the parameters of longest execution for each query. If there is a problem with a changing execution plan caused by changing parameters then you typically will not see the right execution plan here. Therefore you should search for the same query in “SQL Statements” and check the execution plan there.
“Database Processes” in DBA Cockpit
To check the current activity on SQL Server you can use “Database Processes” in DBA Cockpit. For SQL Server 2000 you can see a list with the content of the SQL Server system table “sysprocesses”. For SQL Server 2005 and newer a join of the DMVs “sys.dm_exec_sessions”, “sys.dm_exec_connections” and “sys.dm_exec_requests” is displayed. You can filter by SAP system (using the SQL Server login), application server and SAP work process number. Each SQL Session contains the total number of physical reads, writes and consumed CPU time. Using the “Reset” and “Since Reset” buttons you can easily see which SQL session is currently consuming CPU.
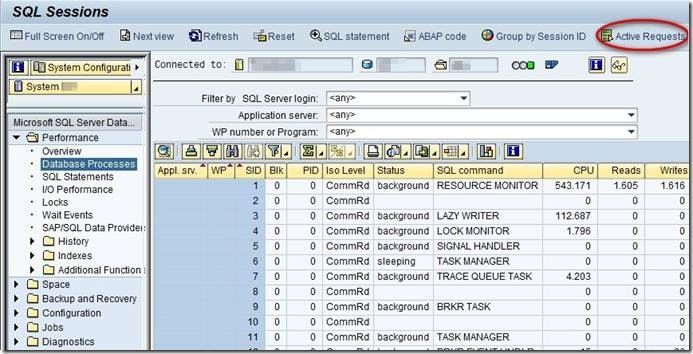
If you want to check the execution plan of a currently running query then you should first press the button “Active Requests”. This filters the output list in DBA cockpit. As a result, only active SQL requests are visible. After this you can display the currently used execution plan of an active request by pressing the “Explain” button.
As long as you do not press “Active Requests” you can see all SQL sessions and connections, including those which do not have an active request. For those connections you also see a SQL statement. However, this is not an actual running statement. It is the most recent statement which ran in the past. Since SQL Server does not have a valid plan handle any more for those SQL statements, you can only create an estimated execution plan for them. Therefore the “Explain” button for the most recent SQL statement is not available any more in the newest release of DBA Cockpit.
Best practices for SAP NetWeaver 700 and newer
The easiest way to find slow SQL statements for an ABAP programmer is the ST05 trace. A database administrator should check “SQL Statements” in DBA Cockpit. For SQL Server 2000 you should use “SAP SQL Statistics” instead.
The best way to figure out an execution plan is “SQL Statements”. For SQL Server 2000 (and SAP NetWeaver 700) you can only be sure about the execution plan when performing a SQL Server profiler trace. For supportability reasons we strongly recommend to upgrade SQL Server 2000 to a newer release when running SAP NetWeaver 700 (or newer).