Here is another great contribution by Clas Hortien in regards to new technologies which got introduced in SQL Server 2008. Clas will continue in this series around XEvents and new technologies.
This blog will briefly discuss how the possibilities of the new tracing functionality of Extended Events can be used for the problem analysis within an SAP system. In this first part the build-in system_health session of SQL Server will be discussed in detail. In later blogs I will show how the extended events can be used for the case of statement analysis as well.
SQL Server 2008 introduced Extended Events (XE) a new event handling system. XE is a flexible and lightweight event trace system and has much less impact than other tracing tools like SQL Profiler.
The main components of the Extended Events tracing are sessions with targets (consumer), events (producer), predicates (filter) and actions (collector for additional information). Each target can consume any event and each event can collect additional information via actions. The main targets are the ring buffer target, the event file target or the event bucketing target.
Events are monitoring points in the execution path of SQL Server. The event fires when the point of interest has been reached and includes state information from the time the event was fired. Events can be used for tracing purposes or to trigger an action. The event itself is not aware what kind of action will be fired. Actions might be started synchronously or asynchronously.
Events can trigger a variety of actions, from the creation of a stack dump or getting the execution plan of an executed statement to the Transact-SQL stack collection.
Predicates are a set of rules to evaluate the events, when they get fired. They can be used to selectively filter the events that are being collected, for instance for a single database or only for a single connection or user.
Unfortunately SQL Server Management Studio does not provide any GUI for defining or altering XE sessions. But you can use the Extended Event Manager, which is freely downloadable from Codeplex . With this tools you can easily define or alter session and you can browse all the metadata of the Extended Event tracing (events, actions, predicates etc.).

Today we want to have a closer look into the build-in session system_health and which events are being collected and how we can retrieve them. By using the XE Manager we can examine the details of this session:

Five different events are collected and stored in a ring buffer target. This target can grow up to 4 MB before old entries are overwritten. The events are
-
error_reported
This events fires when the severity of the error is greater or equal than 20 or if it is one of the errors in this list: 701,802,8645,8651,8657,8902,17803. Beside of the error information (error, severity, state, message etc.) it collects
- the TSQL call stack
- the 16-frame call stack
- the SQL Text
- and the session ID of the query that causes the error
-
scheduler_monitor_non_yielding_ring_buffer_recorded
Fires when a system resource is non yielding.
-
xml_deadlock_report
This event fires on every deadlock and collects only the default data (XML_Deadlock_report)
If you are using SQL Server 2008 Service Pack 1 you should install at least the cumulative update 6 for this service pack, as the generated XML for the deadlock information comes with invalid XML tags. This problem is solved with CU 6 and later. See Microsoft Knowledgebase article 978629 for more details. Using SQL Server 2008 R2, you also need to use CU1 of SQL Server 2008 R2. If these criteria are not met, an error like below will show up when the ring buffer gets queried for deadlocks and deadlocks had been recorded:
Msg 9436, Level 16, State 1, Line 1 XML parsing: line 60, character 12,
end tag does not match start tag
-
wait_info and wait_info_external
Collect information about wait statistics (internal and external waits). The event for the internal waits will fire when the duration of a wait has exceeded 15000 ms, the event for external waits at a duration of 5000 ms. Both are filtered for a set of waits that they capture.
You can retrieve the complete ring buffer by running:
SELECT
CAST(xet.target_data AS xml)
FROM
sys.dm_xe_session_targets xet join
sys.dm_xe_sessions xe
ON (xe.address = xet.event_session_address)
WHERE xe.name = 'system_health'
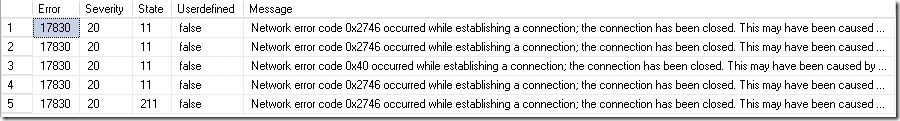
but the output (XML) is not very readable and useful in the current state. To get more useful information we have to parse the XML to a more readable format. For the first type of events (error_reported) the selection have to look like:
select
XEventData.XEvent.value('(data/value)[1]', 'varchar(max)') as Error,
XEventData.XEvent.value('(data/value)[2]', 'varchar(max)') as Severity,
XEventData.XEvent.value('(data/value)[3]', 'varchar(max)') as State,
XEventData.XEvent.value('(data/value)[4]', 'varchar(max)') as Userdefined,
XEventData.XEvent.value('(data/value)[5]', 'varchar(max)') as Message
FROM
(select CAST(target_data as xml) as TargetData
from sys.dm_xe_session_targets st join
sys.dm_xe_sessions s on s.address = st.event_session_address
where name = 'system_health') AS Data
CROSS APPLY TargetData.nodes ('//RingBufferTarget/event'
AS XEventData (XEvent)
where XEventData.XEvent.value(
'@name'
, 'varchar(4000)') = 'error_reported'
You can get the deadlock part of the report by running:
select
cast(XEventData.XEvent.value('(data/value)[1]',
'nvarchar(max)') as XML) as DeadlockGraph
FROM
(select CAST(target_data as xml) as TargetData
from sys.dm_xe_session_targets st join
sys.dm_xe_sessions s on
s.address = st.event_session_address
where name = 'system_health') AS Data
CROSS APPLY TargetData.nodes ('//RingBufferTarget/event')
AS XEventData (XEvent)
where XEventData.XEvent.value(
'@name'
, 'nvarchar(4000)')
= 'xml_deadlock_report'
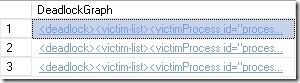
You can even click on the XML result to get the complete deadlock graph with all the statement- and lock information that were involved in that deadlock. This is the same output, which you get when you run the deadlock trace via the SQL Server profiler.
The internal and external wait statistics can be retrieved with a union of two statements:
XEventData.XEvent.value('(data/text)[1]', 'varchar(max)') as wait_type,
XEventData.XEvent.value('(data/text)[2]', 'varchar(max)') as opcode,
XEventData.XEvent.value('(data/value)[3]', 'varchar(max)') as duration,
XEventData.XEvent.value('(data/value)[4]', 'varchar(max)') as max_duration,
XEventData.XEvent.value('(data/value)[5]', 'varchar(max)') as total_duration,
XEventData.XEvent.value('(data/value)[6]', 'varchar(max)') as signal_duration,
XEventData.XEvent.value('(data/value)[7]', 'varchar(max)') as completed_count
FROM
(select CAST(target_data as xml) as TargetData
from sys.dm_xe_session_targets st join
sys.dm_xe_sessions s on s.address = st.event_session_address
where name = 'system_health') AS Data
CROSS APPLY TargetData.nodes ('//RingBufferTarget/event')
AS XEventData (XEvent)
where XEventData.XEvent.value( '@name' , 'varchar(4000)') = 'wait_info'
union all
select
XEventData.XEvent.value('(data/text)[1]', 'varchar(max)') as wait_type,
XEventData.XEvent.value('(data/text)[2]', 'varchar(max)') as opcode,
XEventData.XEvent.value('(data/value)[3]', 'varchar(max)') as duration,
XEventData.XEvent.value('(data/value)[4]', 'varchar(max)') as max_duration,
XEventData.XEvent.value('(data/value)[5]', 'varchar(max)') as total_duration,
null,
XEventData.XEvent.value('(data/value)[6]', 'varchar(max)') as completed_count
FROM
(select CAST(target_data as xml) as TargetData
from sys.dm_xe_session_targets st join
sys.dm_xe_sessions s on s.address = st.event_session_address
where name = 'system_health') AS Data
CROSS APPLY TargetData.nodes ('//RingBufferTarget/event')
AS XEventData (XEvent)
where XEventData.XEvent.value( '@name' , 'varchar(4000)') = 'wait_info_external'

As you can see, does the build-in system_health session already provide many useful information about the overall system state of your SQL Server underneath your SAP system. You can easily track deadlocks without setting up an expensive deadlock trace or determine if severe errors have reported lately in your system. You can an fast overview over wait stats and other problematic resources.
Some useful links about extended event tracing:
http://blogs.msdn.com/extended_events/
http://msdn.microsoft.com/en-us/library/dd822788.aspx
http://support.microsoft.com/kb/978629
 Microsoft