In Exchange Server 2007, we completely rewrote Search - we upgraded from MS-Search 2.0 to 3.0 (which SQL Server 2005 also uses) and we changed from a "crawl" model to an "always up to date" model - we also rewrote the indexing part to be more efficient in how it communicates with the Exchange Information Store - the end result is an 35x improvement in indexing speed.
Because Search used so much resources, it was disabled by default in Exchange Server 2003, In Exchange Server 2007, it is enabled by default, and all our Microsoft Dogfood servers have it running - it hums along nicely, taking between 2 and 5% of CPU in steady state, rather than bringing the machine to its knees every night. Another added benefit of being on top of things is that the new messages are still fresh in the Jet cache, so reading them doesn't cause any additional I/Os.
Two new services handle the indexing work:
- The Exchange Search Indexer is the component responsible for driving the creation and the updates of the search index. Think of it as the conductor - it constantly monitors changes in the system and schedules work in response. For example:
- Adding a new Mailbox Database (MDB) triggers a crawl of the new MDB
- Moving a new Mailbox triggers a crawl of the new mailbox
- Receiving a new email causes the indexer to add the message to the index
- MS-Search: The Search Indexer sends to MS-Search batches of messages (documents in the MS-Search terminology) that need to be indexed. To retrieve the contents of these documents MS-Search calls into an Exchange specific protocol handler that we wrote to get data out of the Exchange Information Store, and then uses a set of filters that are able to understand specific formats (HTML, PDF, Word, Excel, PowerPoint...) and decode them into plain text. To identify the words in the document, MS-Search uses another set of components called word breakers (in some languages like Chinese or Japanese for example, it is not very easy to tell how symbols are grouped to form a word). This is no different that the Windows Content Indexing Service or the Windows Desktop Search.
You might notice that a third process actually uses most of the CPU - it is because MS-Search is actually composed of the core indexer (msftesql.exe) and a sacrificial filter daemon (msftefd.exe) which can be recycled at will. That's where the protocol handler, filters and word breakers live.
The performance of local search in Exchange Server 2007 is significantly better than in Exchange 2003. Search results are returned within seconds, and the search index is also typically updated within seconds after a message is created.
Full crawl is also much faster, but still uses a significant amount of CPU, memory and I/O. During more intensive processing phases, this could in principle disrupt regular mail flow. Since delivery of mail must take precedence over indexing, indexing backs off (throttles) when the load on mailbox server becomes too high. The indexing load is controlled by regulating the number of items (document chunks) that are processed per unit of time. A monitoring thread keeps track of the load on each MDB using the average latency it takes to retrieve documents from the MDB. If this latency crosses a certain threshold (the default is 20 ms), it starts to restrict indexing by setting progressively higher processing delays per MDB (the delay value). Before fetching a document from the MDB, the indexer checks the current throttling delay value, if it's larger than zero, it sleeps accordingly (throttling only occurs during full-crawls).
The delay value (DVt) for period t is calculated according to the following formula:
Errort = Max(0, Latencyt- LatencyThreshold)
PKt = KP*Errort
DVt = Min(MaxDV, (1- alfa )*PKt - alfa*DVt-1))
where LatencyThreshold is the latency that triggers throttling, MaxDV is the maximum allowed delay value, KP is the proportional gain factor and alfa is the feedback factor.
Here is a Performance Monitor screenshot of throttling in action (click on the picture if the width looks cut off for you):
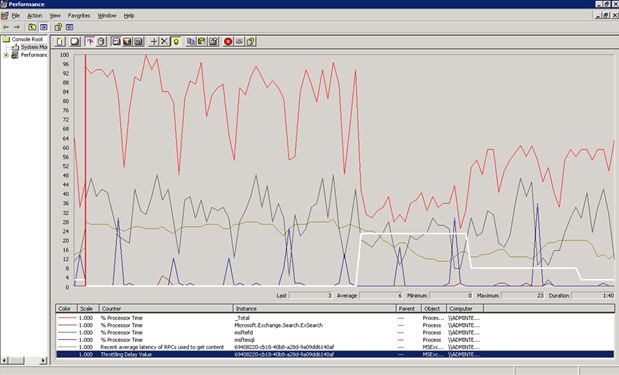
Notice the white line (which shows the delay value) - the red line is the CPU utilization - which shows a dramatic decrease when the delay value increases - the greenish line is the latency.