This article continues the analysis I started in my previous article, DAG: beyond the “A”.
We all understand that a good technology solution must have high levels of availability, and that simplicity and redundancy are the two major factors that drive solution availability. More specifically:
- The simpler the solution (the fewer independent critical components it has), the higher the availability of the solution;
- The more redundant the solution (the more of multiple, identical components that duplicate each other and provide redundant functionality), the higher the availability of solution.
My previous article provides mathematical formulas that allow you to calculate planned availability levels for your specific designs. However, this analysis was performed from a standpoint of a single datacenter (site). Recently the question was asked: how does bringing site resilience to an Exchange design affect the solution's overall level of availability? How much, if any, will we increase overall solution availability if we deploy Exchange in a site resilient configuration? Is it worth it?
Availability of a Single Datacenter Solution
Let us reiterate some of the important points for a single site/datacenter solution first. Within a datacenter, there are multiple critical components of a solution, and the availability of an entire solution can be analyzed using the principles described in DAG: beyond the “A”, based on the individual availability and redundancy levels of the solution components.
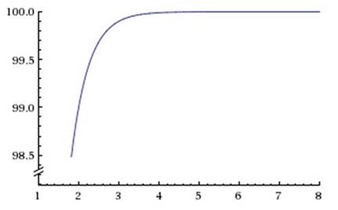
Most interestingly, availability depends on the number of redundant database copies deployed. If the availability of a single database copy is A = 1–P (this includes the database copy, and the server and disk that are hosting it), then the availability of a set of N database copies will be A(N) = 1–PN = 1–(1–A)N. The more copies, the higher the availability; the fewer copies, the lower the availability. The graph below illustrates this formula showing the dependency of A(N) on N:

Figure 1: Availability dependence on the number of redundant copies
Note: All plots in this article were built using the Wolfram Alpha online mathematical computation engine.
For example, if A = 90% (value selected on the graph above), and N=4, then A(4) = 99.99%.
However, the full solution consists not just of the redundant database copies but of many other critical components, as well: Active Directory, DNS, load balancing, network, power, etc. We can assume that the availability of these components remains the same regardless of how many database copies are deployed. Let’s say the overall availability of all of these components taken together in a given datacenter is Ainfra. Then, the overall availability of a solution that has N database copies deployed in a single datacenter, is A1(N)= Ainfrax A(N).
For example, if Ainfra = 99.9%, A = 90%, and N=4, then A1(4)= 99.89%.
Adding Site Resilience
So we figured that availability of a single datacenter solution is A1 (for example, A1=99.9%=0.999). Correspondingly, probability of a datacenter failure is P1=1–A1 (in this example, P1=0.1%=0.001).
Let’s assume that a second site/datacenter has availability of A2 (it could be the same value as A1 or it could be different – it depends on the site configuration). Correspondingly, its probability of failure is P2=1– A2.
Site resilience means that if the solution fails in the first datacenter, there is still a second datacenter that can take over and continue servicing users. Therefore, with site resilience the solution will fail only when *both* datacenters fail.
If both datacenters are fully independent and don’t share any failure domains (for example, they don’t depend on the same power source or network core switch), then the probability of a failure of both datacenters is P= P1xP2. Correspondingly, the availability of the solution that involves site resilience based on two datacenters is A = 1–P = 1–(1–A1)x(1–A2).
Because values of both P1 and P2 are very small, the availability of a site resilient solution effectively sums the “number of nines” for both datacenters. In other words, if DC1 has 3 nines availability (99.9%), and DC2 has 2 nines availability (99%), the combined site resilient solution will have 5 nines availability (99.999%).
This is actually a very interesting result. For illustration, let us use datacenter tier definitions adopted by ANSI/TIA (Standard TIA-942) and the Uptime Institute, with the availability values for four datacenter tiers defined as follows:
| Datacenter Tier Definition | Availability (%) |
| Tier 1: Basic | 99.671% |
| Tier 2: Redundant Components | 99.741% |
| Tier 3: Concurrently Maintainable | 99.982% |
| Tier 4: Fault Tolerant | 99.995% |
We can see that if we deploy two relatively inexpensive Tier 2 datacenters, the resulting availability of the solution will be higher than if we deploy one very expensive Tier 4 datacenter:
| Availability (%) | |
| Datacenter 1 (DC1) | 99.741% |
| Datacenter 2 (DC2) | 99.741% |
| Site Resilient Solution (DC1 + DC2) | 99.9993% |
Of course, this logic applies not only to datacenter considerations but also to any solution that involves redundant components. Instead of deploying an expensive single component (e.g., a disk, a server, a SAN, a switch) with a very high level of availability, it might be cheaper to deploy two or three less expensive components with properly implemented redundancy, and it will actually result in better availability. This is one of the fundamental reasons why we recommend using redundant commodity servers and storage in the Exchange Preferred Architecture model.
Practical Impact of Site Resilience
The advantage of having two site resilient datacenters instead of a single datacenter is obvious if we assume that site resilient solutions are based on the same single datacenter design implemented in each of the two redundant datacenters. For example, if we compare one site with 2 database copies and two sites with 2 database copies in each, obviously the second solution has much higher availability, not so much because of site resilience but simply because now we have more total copies – we moved from 2 total copies to 4.
But this is not a fair comparison. What is the effect of the site resilience configuration itself? What if we compare the single datacenter solution and the site resilient solution when they have the same number of copies? For example, single datacenter solution with 4 database copies and a site resilient solution with two sites with 2 database copies in each site (so that both solutions have 4 total database copies). Here the calculation becomes more complex.
Using the results from above, let’s say the availability of a solution with the single site and M database copies is A1(M) (for example, A1(4)=99.9%=0.999). Obviously, availability of the same solution but with fewer database copies will be lower, (for example, A1(2)=90%=0.9).
Let’s assume similar logic for the second site: let it have N copies and a corresponding availability of A2(N).
Now we need to compare the following values:
- Availability of a single site solution with M+N copies: AS = A1(M+N)
- Availability of a site resilient solution with M copies in the 1st site and N copies in the 2nd site:
ASR = 1–(1–A1(M))x(1–A2(N))
These values are not very easy to calculate, so let us assume for simplicity that both datacenters are equivalent (A1 = A2) and both have equal number of copies (M=N). Then we have:
AS = A1(2N)
ASR = 1–(1– A1(N))2
We know that A1 = Ainfra x A(N), and that A(N) = 1–PN = 1–(1–A)N. Since we consider datacenters equivalent, we can assume that Ainfrais the same for both datacenters. This gives us:
AS = Ainfra x (1–(1–A)2N)
ASR = 1–(1– Ainfra x (1–(1–A)N))2
These values depend on three variables: Ainfra, A, and N.
To compare these values, let us fix two of the variables and see how the result depends on the third one.
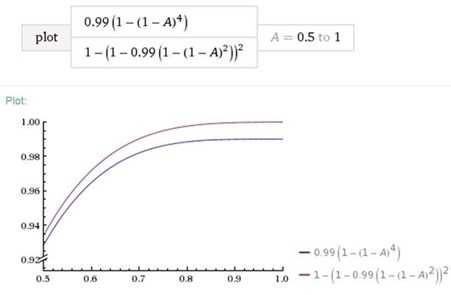
One comparison is to see how the values change depending on A if Ainfra and N are fixed. For example, let Ainfra= 99% = 0.99, and N=2:

Figure 2: Availability dependence on number of redundant copies for the single site and site resilient scenarios
The blue line (bottom curved line) represents the single datacenter solution, and the purple line (top curved line) represents the site resilient solution. We can see that site resilient solution always provides better availability, and the difference is steady even if the availability of an individual database copy approaches 1. This is because the availability of other critical components (Ainfra) is not perfect. The better Ainfra(the closer it is to 1), the smaller the difference between the two solutions.
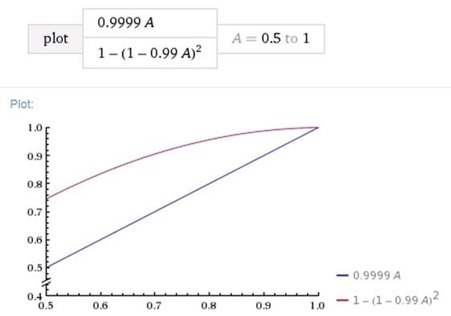
To perform another comparison and confirm the last conclusion, let us see how availability changes depending on Ainfraif A and N are fixed. For example, let A=0.9 and N=2:

Figure 3: Availability dependence on the datacenter infrastructure availability for the single site and site resilient scenarios
Again, we can see that the site resilient solution provides better availability but the difference between the two availability results is proportional to 1–Ainfra and so it vanishes when Ainfra–>1, which confirms the conclusion made earlier.
In other words, if your single datacenter has a perfect 100% availability, then site resilient solution is not needed. Now isn’t that obvious without any calculations?
The following table illustrates these results:
| Availability of a single copy | 90.000% |
| Datacenter infrastructure availability (Ainfra) | 99.900% |
| Impact of site resilience | # copies/site | Availability (%) |
| Single Datacenter | 4 | 99.890010% |
| Two Datacenters | 2 | 99.987922% |
| Difference ~ 1-Ainfra | 0.100% | 0.097912% |
You can leverage this simple Excel spreadsheet (attached to this blog post) that allows you to play with the numbers representing Ainfra, A, and N (they are formatted in red), and see for yourself how it affects resulting availability values.
Summary
Deploying a site resilient design increases availability of a solution, but the benefit of site resilience diminishes if a single datacenter solution has high level of availability by itself.
Using the formulas above, you can calculate exact availability levels for your specific scenarios if you use proper input values.
Note: To avoid confusion, everywhere above we are talking about planned availability. This purely theoretical value demonstrates what can be expectedof a given solution. On comparison, the actually observed availability is a statistical result; in actual operations, you might observe better or worse availability values, but the averages over the long period of monitoring should be close to the theoretical values.
Acknowledgement: Author is grateful to Ramon Infante, Director of Worldwide Messaging Community at Microsoft, and Jeffrey Rosen, Solution Architect and US Messaging Community Lead, for helpful and stimulating discussions.
Boris Lokhvitsky
Delivery Architect
Microsoft Consulting Services