What is Regtrace?
Regtrace is an extremely useful debug tool, which helps Exchange Escalation Engineers and Developers to diagnose and resolve an Exchange 2000 problem, usually transport related problems. There are many scenarios where Regtrace data is required to debug and troubleshoot an Exchange issue.
Regtrace is shipped with Windows 2000 Server and Exchange 2000 Server; and it can be found under: C:\WINNT\System32 folder. It is also shipped with Exchange Server 2003 and can be found under: C:\WINDOWS\System32. It's not shipped with Windows Server 2003. Regtrace.exe is also located on the Exchange 2000 Server CD in the Support\Utils\I386 folder.
Pttrace.dll is the actual module which does the tracing, and all other components load / initializes pttrace.dll for tracing their individual components. On Exchange Server 2000, pttrace.dll is found under: C:\Program Files\Exchsrvr\BIN folder. On Exchange 2003 Server, pttrace.dll is found under: C:\Program Files\Microsoft Integration\ Microsoft Exchange.
Why did I want to write a blog post on this topic?
I am in Exchange Escalation Services team and specifically in the group which handles Exchange Critical Situation (CritSit) Cases (aka the ER or The Trauma Center). I am always amazed to see the number of cases which are generated as CritSits because someone did not disable Regtrace correctly. That "someone" could be customers, support engineers, on-site engineers, consultants etc. These CritSits come to us as Server down situations, since a majority of the time this situation happens on busy SMTP Gateways, internal RG BH servers, stopping mail flow. However, it also happens on Mailbox or Back end servers, as well. CritSits are always highly visible within Microsoft, including the Executive level. They are often political situations, disrupting server uptime, and even impacting customers' SLAs. Based on past experiences, these CritSits will go on for many, many hours and even several days, requiring extensive troubleshooting / debugging, and without anyone detecting and pin pointing the root cause. These situations almost always require Microsoft to dispatch onsite resources, and customers to engage their resources round the clock until the issue can be resolved.
Why is it important to disable Regtrace correctly?
Regtrace is basically a debugging tool (like Windbg) and trace.atf file is like a user.dmp file. However, they contain different types of data in them. User.dmp has specific 2 GB worth of virtual memory address space (typically from 0x00000000 to 0x7FFFFFFF, unless / 3GB switch is enabled, in which case, it will be 0x00000000 to 0xBFFFFFFF) for specific process, e.g. Store.exe. On the other hand, Regtrace records the activity of what functions get called, and what results get returned from these function calls for each component, e.g. Advanced Queuing (AQ). Since Regtrace is a debug tool, it has a very heavy footprint on the Server where it is running or left enabled. It's about an additional 30% load on the CPU. In typical cases, on busy servers, the server context switches so badly that the server slowly dies.
In our customers' situations, we have seen the server performance impacted significantly because tracing (i.e. pttrace) was disabled but the EnabledTraces mask left on. This is particularly painful the first time you launch Regtrace. If you immediately close it, you end up with all traces turned on even though no file is set for tracing. The basic problem is no one pays any attention to OutputTraceType setting when deciding to trace, they only check the EnabledTraces mask. It's also seen very commonly in customers CritSit situations to leave the OutputTraceType enabled, without realizing the detrimental effects of it.
If the Regtrace is left enabled, it's just exactly like setting up dynamite on your server, the only difference is this will blow up on its own time of choosing, which typically falls right in the middle of business hours, and specifically when the server is under heavy load. In other words, it's not a question of "if" your server will blow up, rather it becomes "when" it will blow up. In most cases, the server runs into issues within few days to less than a month time frame.
What are the symptoms and how to detect it?
When Regtrace is left enabled on production Exchange Servers, it has the potential to cause performance /transports issues on Exchange Servers. Specifically speaking, system queues will start to backup, and message processing will slow down tremendously. The symptoms include either one or ANY combination of the following system queues will be backed up: Messages awaiting Directory Lookup, Local Delivery, Pre-Submission, Messages awaiting Routing, MTA Work Queue Length. Depending on the load on the server (i.e., the number of messages stuck in the system queues, and stress conditions on other components) you may also experience other performance related symptoms. For example, doing simple tasks like viewing system queues, enumerating messages, viewing Queue folder, etc will take a longer time than usual. In certain situations, you may see high CPU on the Inetinfo and / or store processes. Application log will not log any events to point this condition out, at any logging level, not even at the debug level 7. However, recent version of ExBPA will detect this condition and raise a warning flag. A user dump of the Inetinfo.exe process will also detect this condition. In the user dump files, if you see pttrace.dll file on the call stack for thread in contention then you can safely assume Regtrace is causing performance problems. However, the easiest and the fastest way to detect and correct this condition is to inspect and disable it manually. Steps on how to correctly do this are described below.
If you have used an automated regkey to enable, and / or disable, it's a best practice to verify manually that the Regtrace is truly and correctly disabled.
How to disable Regtrace correctly
The correct procedure to disable Regtrace is as follows:
(As an FYI, Regtrace GUI can be accessed by going to the Start menu's run command, and typing in "Regtrace")
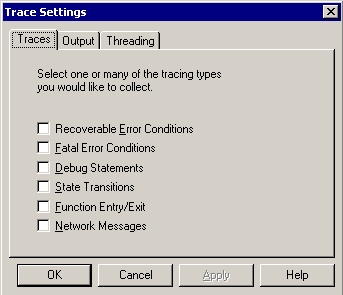
1. On the Regtrace GUI "Traces" tab, make sure all the check boxes are "unchecked", just like shown below:

2. On the Regtrace GUI "output" tab, make sure the radio button option for "No tracing" is selected, and Apply button must be grayed out ( if not then you must click on Apply button), just like shown below:

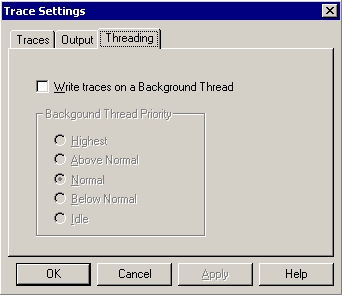
3. "Threading" tab's "Write traces on a Background Thread" option should always be turned OFF / disabled. Period. If you turn it on then there is bug in regtrace where some of the trace data is getting overwritten. It's not a hard requirement to correctly disabled the regtrace. However, I would like to point out that it's a best practice to leave it permanently disabled.
Since it's not a hard requirement, If "Threading" tab's "Write traces on a Background Thread" option is enabled, and thread priority is higher than normal e.g. "above normal" or "highest priority" there should not be any additional affect on the performance, because of thread priority being higher than normal.

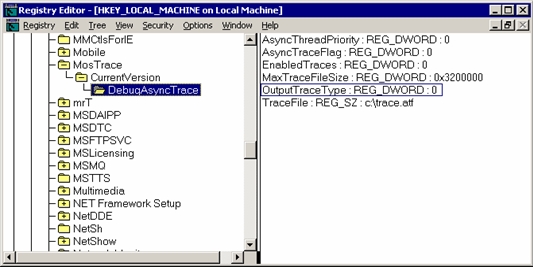
4. Make sure the "Modules" regkey does NOT exist at the following registry path. If it does exist please delete it. The regedt32 view under the following regkey path should look exactly like as shown below:
HKEY_LOCAL_MACHINE\Software\Microsoft\MosTrace\CurrentVersion\DebugAsyncTrace
Please note, if regtrace is enabled and Modules regkey is NOT present, regtrace is going to log trace info for most components automatically.
But if Regtrace settings are not enabled (i.e. disabled correctly), and Modules key is present, Transports components will not trace anything, and not take any CPU hit, however, it's possible some non-transports components for example DSAccess & DS2MB (which runs under the System Attendant) may spend CPU cycles on tracing and take performance hit, since these components have tracing initialized (i.e. pttrace loaded) by default. Since tracing is disabled, it does not get written to the output file. However, it may still cause performance impact. Performance impact is directly related to load and stress conditions on the server, so it may not make much difference on not so busy servers, but on busy or extremely busy Servers this can be significant.

Note on Exchange 2003:
In Exchange 2003, you do NOT need to uncheck the boxes on "Traces" tab in the Regtrace GUI. This actually has been fixed in Exchange Server 2003. But all other steps MUST be followed.
In Windows Server 2003 EXSTRACE.dll was already fixed. The change was ported to PTTRACE.dll. To make this less painful to customers, in E2K3 we set the mask to zero when the OutputTraceType is zero, by making a change in GetTraceFlagsFromRegistry. Or in other words, In GetTraceFlagsFromRegistry, if the output is no tracing, we clear the bit mask. So this is fixed in Exchange 2003.
Regtrace GUI and Registry keys
Description and relation between the GUI options and Registry keys (both for E2K & E2K3).
The registry keys mentioned below can also be found at this same regkey path:
HKEY_LOCAL_MACHINE\Software\Microsoft\MosTrace\CurrentVersion\DebugAsyncTrace
TRACES TAB
EnabledTraces
"Traces" tab \ All the check boxes. The registry will show different values depending on what traces are turned on. Zero means all traces are turned off or disabled.
When you run regtrace, the Traces tab in regtrace corresponds to the EnabledTraces in the registry. Below is breakdown on how the bits gets enabled and what the values would mean in the EnabledTraces tab.
- 0000 0001 = Fatal Error Condition
- 0000 0010 = Recoverable Error Conditions
- 0000 0100 = Debug Statements
- 0001 0000 = Function Entry/Exit
- 0000 1000 = State Transit
- 0010 0000 = Network Messages
- 0100 0000 = PfdTrace
e.g.
40 hex = 0100 0000 = Only PFDTrace is turned on.
44 hex = 1000100 which means you are enabling PfdTrace + Debug Statements..
127 hex = 100100111 = Fatal + Recoverable + Debug + Network Messages. And so forth.
OUTPUT TAB
OutputTraceType
"Output" tab \ "No tracing" option. If selected disables tracing by setting regkey to 0, if not selected then regkey can have the following values based on what's selected:
No tracing = 0
Debugger = 2
Discard (or internal use) = 4
File = 1 ( This enables regtracing in normal mode)
TraceFile
"Output" tab\ "File" option. It actually stores the name and path of output regtrace file e.g. c:\trace.atf
MaxTraceFileSize
"Output" tab \ Max Trace File Size (MB). It stores the size of output file in MB. Maximum size of the trace file before regtrace writes over the file specified in the file section. If you encounter a situation where you need to trace continuous information without overwriting the original file, then PSS can provide you a tool, which lets you wrap around the output file based on the file size specified.
THREADING TAB
AsyncTraceFlag
"Threading" tab \ "Write traces on a Background Thread" option. If unchecked/disabled (i.e regkey is set at 0) regtrace logs traces sequentially and use a foreground thread. When regkey is set at 1, "Write Traces on a BackGround Thread "is turned on.
AsyncThreadPriority
"Threading" tab \ "Background Thread Priority" option. It can have different value for each priority level:
Highest = 2
Above Normal = 1
Normal = 0
Below Normal = 0xffffffff
Idle = 0xfffffff1
Some additional reading on the subject:
XCON: How to Set Up Regtrace for Exchange 2000 (238614)
Published Apr 26, 2005
Version 1.0The_Exchange_Team Microsoft
 Microsoft
Joined April 19, 2019
Exchange Team Blog
You Had Me at EHLO.