Introduction
Often times in Exchange Support we get cases reporting that the size of one or more Exchange databases is growing abnormally. The questions or comments that we get will range from “The database is growing in size but we aren’t reclaiming white space” to “All of the databases on this one server are rapidly growing in size but the transaction log creation rate is “normal”. This script is aimed at helping collect the data necessary in determining what exactly is happening. For log growth issues, you should also reference Kevin Carker’s blog post here.
Please note when working with Microsoft Support, there may still be additional data that needs to be captured. For instance, the script does not capture things like mailbox database performance monitor logging. Depending on the feedback we get, we can always look at building in additional functionality in the future. Test it, use it, but please understand it is NOT officially supported by Microsoft. Most of the script doesn’t modify anything in Exchange, it just extracts and compares data.
Note: The space dump function will stop (and then restart) the Microsoft Exchange Replication service on the target node and replay transactions logs into a passive copy of the selected database, so use this with caution. We put this function in place because the only way to get the true white space of a database is with a space dump. People often think that the AvailableNewMailboxSpace is the equivalent of whitespace, but as Ross Smith IV notes in his 2010 Database Maintenance blog “Note that there is a status property available on databases within Exchange 2010, but it should not be used to determine the amount of total whitespace available within the database. AvailableNewMailboxSpace tells you how much space is available in the root tree of the database. It does not factor in the free pages within mailbox tables, index tables, etc. It is not representative of the white space within the database.” So again, use caution when executing that function of script as you probably don’t want to bring a lagged database copy into a clean shutdown state, etc.
Before we get into an example of the script, I wanted to point out something you should always check when you are troubleshooting database growth cases – what is the total deleted item size in the database and are any users on Litigation hold.
The following set of commands will export the mailbox statistics for any user that is on Litigation Hold for a specific database and furthermore will give you the sum of items in the recoverable items folder for those users (remember we use the subfolders Versions and Purges when Lit Hold is enabled).
1. Export the users mailbox statistics per database that have litigation hold enabled
get-mailbox -database <database name> -Filter {LitigationHoldEnabled -eq $true} | get-mailboxstatistics | Export-CSV LitHoldUsers.csv
2. Import the new CSV as a variable:
$stats = Import-Csv .\LitHoldUsers.csv
3. Get the sum of Total Deleted Item Size for the Lit Hold users in the spreadsheet
$stats | foreach { $bytesStart = $_.TotalDeletedItemSize.IndexOf("(") ; $bytes = $_.TotalDeletedItemSize.Substring($bytesStart + 1) ; $bytesEnd = $bytes.IndexOf(" ") ; $bytes = $bytes.Substring(0, $bytesEnd) ; $bytes } | Measure-Object –Sum
This will give you the sum for the specific database of recoverable items for users on litigation hold. I’ve seen cases where this amount represented more than 75% of the total database size. You also want to confirm what version of Exchange you are on. There was a known store leak fix that was ported to Exchange 2010 SP3 RU1. I don’t believe the KB is updated with the fix information, but the fix was put in place, so before you start digging in too deep with the script, make sure to install SP3 RU1 and see if the issue continues.
Ok moving onto the script. What can the script do you ask? The script can do the following:
- Collects mailbox statistics across the specified database, adding mutable note properties for future use in differencing
- Collects database statistics for the specified database, adding mutable note properties for later differencing.
- Collects mailbox folder statistics for all mailboxes on the specified database, adding mutable properties for later differencing
- Compares size and item count attributes of the input database from the differencing database, returning a database type object with the modified attributes
- Compares size and item count attributes of the input mailbox from the differencing mailbox, returning a mailbox type object with the modified attributes
- Compares size and item count attributes of the input folder from the difference folder, returning a folder type object with the modified attributes.
- Compares size and item count attributes of the input report from the difference report, returning a report type object with the modified attributes.
- Exports a copy of a report (database, mailbox, and folder statistics) to the specified path or current directory in *.XML format
- Imports an *.XML report and exports it to *.CSV format.
- Imports the report details from the specified file path (database, mailbox, and folder statistics)
- Outputs database details and top 25 mailboxes by size and top 25 folders by size
- Collects a space dump, ESEUTIL /MS, from a passive copy of the specified database and writes to *.TXT
- Searches for events concerning Online Maintenance Overlap and Possible Corruption, outputting them to the screen
- Collects and exports current Store Usage Statistics to *.CSV
You can download the ExchangeDatabaseGrowthReporting.PS1 script as an attachment of this blog post.
Sample script run
Issue reported: “Mailbox Database 0102658021” is rapidly growing in size.
- List options to use with -mode switch:
- Choose Collect and Export the data for the database that is growing in size (enter mode 1)
- Specify a path or use the current working directory. Quotes around the path is optional, but the path must already exist.
- Specify the database name. It will run against the active copy. Quotes are optional.
- Depending on the size of the database, folder counts, etc. this could take some time to run from here. Once the report is generated you will be prompted to select the top # of items to display from each report. 25 is the default if you just press enter.
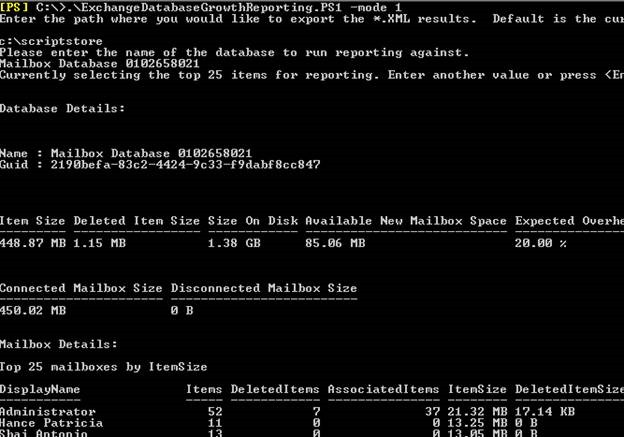
- The onscreen reports will now generate. Note DB size on disk here is 1.38GB.
The onscreen reports that you can scroll through include the Database size details and individual reports for the Top 25 of the following: mailboxes by item size, mailboxes by DeletedItemSize, mailboxes by item count, mailboxes by deleted item count, mailboxes by associated items, Folders by size, Folders by item count, and Folders by deleted item count.
The Full XML report will be stored in the location you specified.
If you close out of the PowerShell window and wish to review the reports again, just run the script in mode 2 (quotes are optional).
Now we have a valid report at a single point in time of what's going on in the database. Since we are troubleshooting a “Database Growth” issue, we will need to wait some time for the database to grow. If you have ample space on the database drive, then I would run the report every 24 hours.
Once you ready, compile a second report of the database (same way you did the first above)
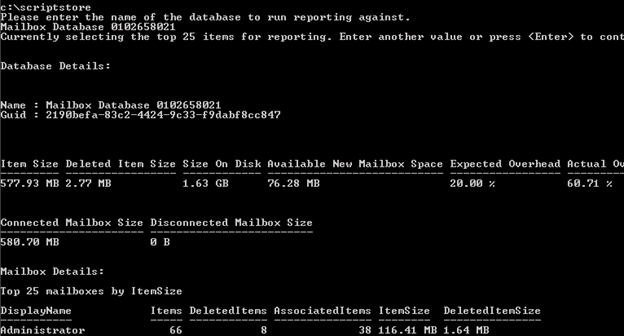
Press enter for top 25 items and the onscreen report will start scrolling through. As you can see below our database size increased on disk from 1.38 GB to 1.63 GB.
So what grew? Well now we will use Mode 3 of the script to compare the 2 XML reports. Note the second XML report in the directory:
Run the script with –mode 3. You will be prompted to enter the full file pat h for the original report and then the second report after the DB growth was recognized.
Once the differential is completed you will see a report that is similar to the first two reports. Keep in mind this is a DIFFERENTIAL Report, so it is reporting on how many items in a particular folder grew or how much the DB grew, etc.
As you can see above the size on disk shows 256mb. This is actually how much the database grew as we know that it went from 1.38gb to 1.63gb. If I scroll through the reports, I can see that the Administrator mailbox is where most of the growth took place (which is where I added the content).
This data can be used to tell what user(s) might be causing the additional growth. As noted earlier, we have had some “phantom” growth cases as well where we had known store leaks which is why it is imperative to make sure you have installed Exchange 2010 SP3 RU1. Its possible that you could run into that type of scenario here, but the data should support that as you would see DB on disk grow but no real growth in the mailboxes at which point you would need to engage Microsoft Support.
A quick note on the Actual Overhead value. This is calculated by taking the physical size of the database and subtracting the AvailableNewMailboxSpace, TotalItemSize and TotalDeletedItemSize. Remember that AvailableNewMailboxSpace is not the true amount of whitespace, so the actual number may be a little higher than what is reported here.
Other script parameters
The remaining modes of the script should be pretty self explanatory.
Mode 4 – Export Store Usage Statistics just uses the built in Get-StoreUsageStatistics function allowing you to run it at a server or database level.
Mode 5 – Will search the application log for events concerning Online Maintenance Overlap and Possible Corruption, outputting them to the screen. We probably didn’t get every event listed here, so we can add events as we see them.
Mode 6 – Will search the server that it is run on for passive copies of databases. It will alert you to any that are configured as lagged copies. If you choose to run this against a passive copy to get the true white space, then it will stop the Microsoft Exchange Replication service, do a soft replay of logs needed to bring the passive copy into a clean shutdown, and then run an ESEUtil /MS against the passive copy. Once completed it will restart the Replication service.
Mode 7 – will just read in one of the XML reports created from Mode 1 and break it out into its individual component reports in CSV format.
Jesse and I decided to build this because we continue to see cases on database growth, so a special thanks to him for running with the idea and compiling the core components of the script. We both had been running our own versions of this while troubleshooting cases, but alas, his core script was better (I still got to add some of the fun ancillary components). We’d like to thank Bill Long for planting the idea in our heads as he worked so many of these cases from a debugging standpoint as well as David Dockter and Rob Whaley for their technical review.
Hopefully this helps you troubleshoot any database growth issues you run across. We look forward to your comments and are definitely open to suggestions on how we can make this better for you.
Happy Troubleshooting!
Jesse Newgard and Charles Lewis
Sr. Support Escalation Engineers
Updated Apr 28, 2020
Version 4.0The_Exchange_Team Microsoft
 Microsoft
Joined April 19, 2019
Exchange Team Blog
You Had Me at EHLO.


