Observe, analyze, investigate, and optimize your Microsoft Foundry and GenAI agents - from traces, tool calls, and token usage to the full Azure stack behind them with one AI companion built into Azure Monitor - The Azure Copilot Observability Agent
Generative AI (GenAI) agents are moving from prototypes to production, running as part of real distributed applications. When a Microsoft Foundry agent slows down, returns errors, or spikes in token usage, teams need to know why - fast, and with evidence. The Azure Copilot Observability Agent, generally available and powered by Azure Monitor, makes Foundry and GenAI agent investigations a first-class scenario. You can investigate agent failures, latency, tool-call errors, and backend saturation through the same signals that run your Azure estate.
Why AI observability matters in production
Building an agent is one thing. Running a fleet of them at scale, in front of real users, is another. AI applications also introduce behaviors that traditional monitoring wasn't built to explain:
- Non-deterministic outputs - the same prompt can take a different path through the agent's logic.
- New failure modes - hallucinations, tool-call failures, and reasoning that silently goes off track.
- Cost and latency that shift with behavior - tokens and response time depend on what the agent decides to do, which models are used and so on.
- Fleet-scale complexity - many agents, across frameworks and hosting, each part of a larger system.
AI observability closes this gap. You need to observe your AI workflows, understand their health, and investigate when an agent is failing, slow, or behaving in ways users notice.
From telemetry to analysis and investigation
Microsoft Foundry is your home for building and evaluating agents, while Azure Monitor makes those agents a first-class item you can observe through traces, tool calls, dependencies, token usage, and evaluation signals - across frameworks and hosting environments. Once you instrument your agents, their telemetry flows into Azure Monitor through Application Insights, and the Observability Agent reasons over it there. Setting this up is a straightforward process: instrument the agent, confirm telemetry is landing, then work with it in Azure Monitor. The Monitor AI Agents with Application Insights walks you through the experience and lets you jump directly from an agent's Monitoring tab in Foundry to Azure Monitor, and New capabilities to observe agents in Azure Monitor covers the wider telemetry pipeline behind it.
Telemetry tells you what happened, Analysis helps you make sense of it, and investigations tell you why. Most days start with analytics: you can chat with your observability data in natural language - ask for an error summary, a latency overview, or dependency health, then follow up to explore a pattern and decide whether something warrants a deeper look. So, the Observability Agent isn't only for investigations; it's also how you analyze and explore your agent telemetry day to day. When that exploration surfaces a real problem and you need the why, it escalates into deep investigations and root cause analysis for GenAI scenarios. The Azure Copilot Observability Agent reasons across your telemetry - logs, metrics, traces, alerts, dependencies, Foundry telemetry, and changes - together with Azure resource context, discovered topology, and relevant instructions. It frames hypotheses, gathers evidence, rules out weak explanations, and shows the reasoning behind its findings. Because it runs inside Azure Monitor, it inherits the access controls you already use - chat and investigations run with the signed-in user's identity and Azure role-based access control (RBAC), and your prompts and responses aren't used to train foundation models.
For Foundry and GenAI agents, you can investigate issues including agent failures and errors, latency, tool-call failures and failing Model Context Protocol (MCP) or backend dependencies, token spikes, and regressions after deployments - prioritizing the failure, latency, and throttling patterns that matter most.
It's powered by the same investigation model the Observability Agent applies to your applications, Azure Kubernetes Service (AKS), and virtual machines (VMs). Autonomous operations, in public preview, can analyze alerts in the background, correlate related alerts, and create Azure Monitor issues with findings and next steps - preparing context and reducing triage work, with humans in control.
Deep investigation through the Azure stack
One of the Observability Agent's key strengths is that it doesn't stop at the agent boundary. It investigates through the Azure stack - from the agent to its dependencies and tool calls, down to the infrastructure behind them.
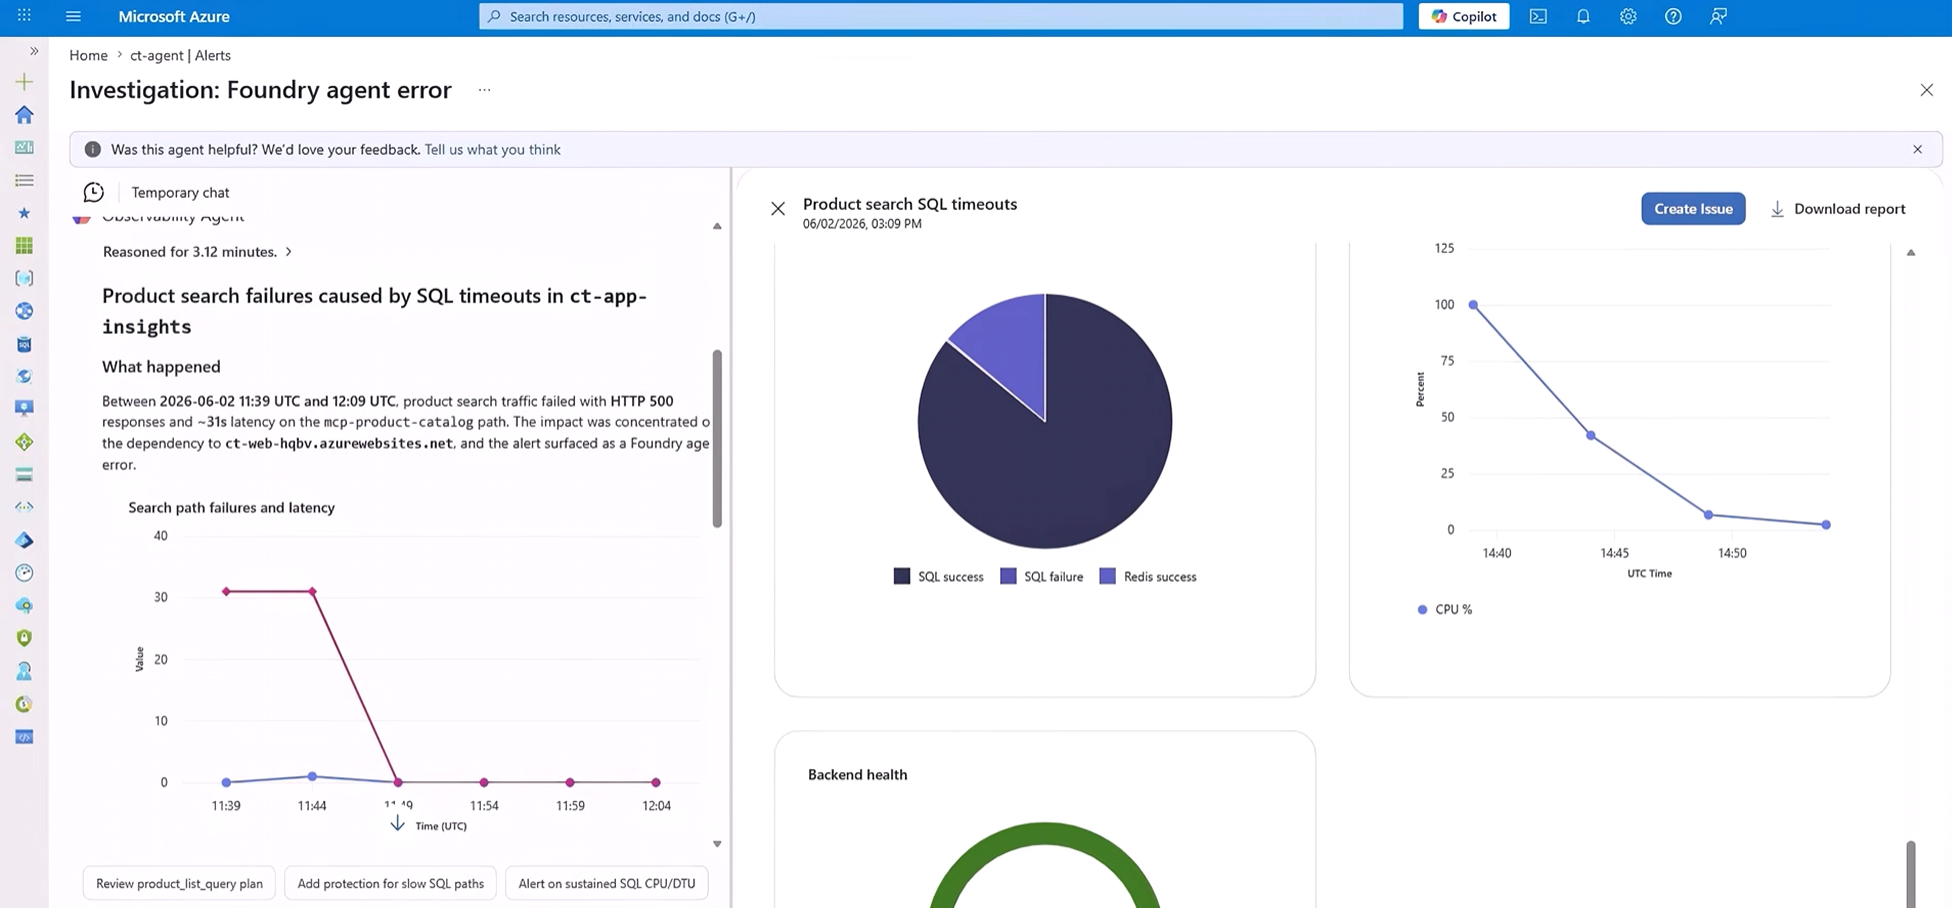
Take a common Foundry pattern: agent failures caused by backend SQL saturation. When a Foundry GenAI agent starts failing, the root cause can go beyond the model or the prompt. The agent scopes to the affected agent, its dependencies and tool calls, and the SQL backend; correlates the failures with SQL timeouts and a spike in failed dependency calls; rules out alternatives like cache issues or a broader outage; and identifies a short SQL saturation window often driven by a high-cost query as the cause. For more patterns, read the deep investigation examples for the Azure Copilot Observability Agent.
Watch it in action:
A closer look: diagnosing an agent over a time range
To see how this plays out, point the Observability Agent at a specific agent and a time range say, the last 24 hours, and ask it to diagnose operation and performance. Instead of a single answer, it works through the problem the way an experienced operator would, across three lines of reasoning.
Failure patterns. It first establishes whether failures trace back to one dominant cause or several unrelated ones, and identifies which tools and dependencies are failing most and with what error and GenAI error types. It separates expected, app-level failures - validation errors, 400s and 404s - from platform and reliability failures like 5xx responses, timeouts, and dropped connections, so you don't spend time on noise. For each top failure type, it points to the likely locus: Main agent, sub-agent, tool, or a downstream service shows the supporting evidence, and proposes the most actionable fix.
Latency and slow runs. When a run is slow, it traces the end-to-end flow - entry point, agent steps, model and tool calls, and downstream dependencies - and shows where the time actually goes. If you give it a specific run, it walks that transaction step by step; if you don't, it looks across runs to find where latency concentrates: The large language model (LLM) call, a tool call, orchestration, or a downstream dependency, and tells you whether the slowness is systemic or isolated.
Throttling and quota pressure. It confirms whether you're seeing throttling signals - 429s, 503s, timeouts, and backoff patterns - and attributes them to the most likely source: the model or provider, the Foundry runtime, or another dependency. It also checks whether retries and backoff are helping or actually amplifying the problem.
The result isn't a dashboard you have to interpret. It's a prioritized, evidence-backed read on what's failing, what's slow, and what's being throttled - with the reasoning shown at each step, so you can act on it or dig further.
Get started
The Azure Copilot Observability Agent is generally available in Azure Monitor, and autonomous operations are available in public preview.
- Instrument your Foundry and GenAI agents, then explore them in the agents view in Azure Monitor.
- See what's possible once agents are instrumented in New capabilities to observe agents in Azure Monitor.
- Learn how to use the Azure Copilot Observability Agent.
- Explore how deep investigations in the Azure Copilot Observability Agent work.
- Read the announcement: Azure Copilot Observability Agent is generally available, with autonomous operations in preview.
What's next for Foundry and GenAI agents
The Observability Agent already reasons about the scenarios that matter most for GenAI agents today: It investigates agent failures, latency, and performance, and it also understands token economy and works with evaluation signals. Here's where we're investing next:
- Advanced token analysis - clearer visibility into where tokens go, which runs are most expensive, and how model and prompt choices affect cost.
- Deeper failure attribution - pinpoint whether an issue comes from agent logic, model behavior, or a backend dependency, so you troubleshoot the right layer.
- Richer evaluation correlation - easier ways to tie quality regressions to the specific runs, prompts, and changes behind them.
These additions extend the Observability Agent's existing strengths while keeping the same governed, evidence-first, human-in-control model you rely on today.
Stay connected
- Follow this blog for ongoing deep dives, updates on current capabilities, and a preview of what's coming next.
- Live webinar - a walkthrough of real Observability Agent scenarios, best practices, and what's available today - along with a look at what's coming next, and live Q&A with the product team. Register for the Observability Agent webinar
We'd love your feedback
The Observability Agent continues to evolve based on real-world usage and operator feedback. Share your thoughts directly through the Give Feedback option in the experience or reach us at rofrenke@microsoft.com.

 Microsoft