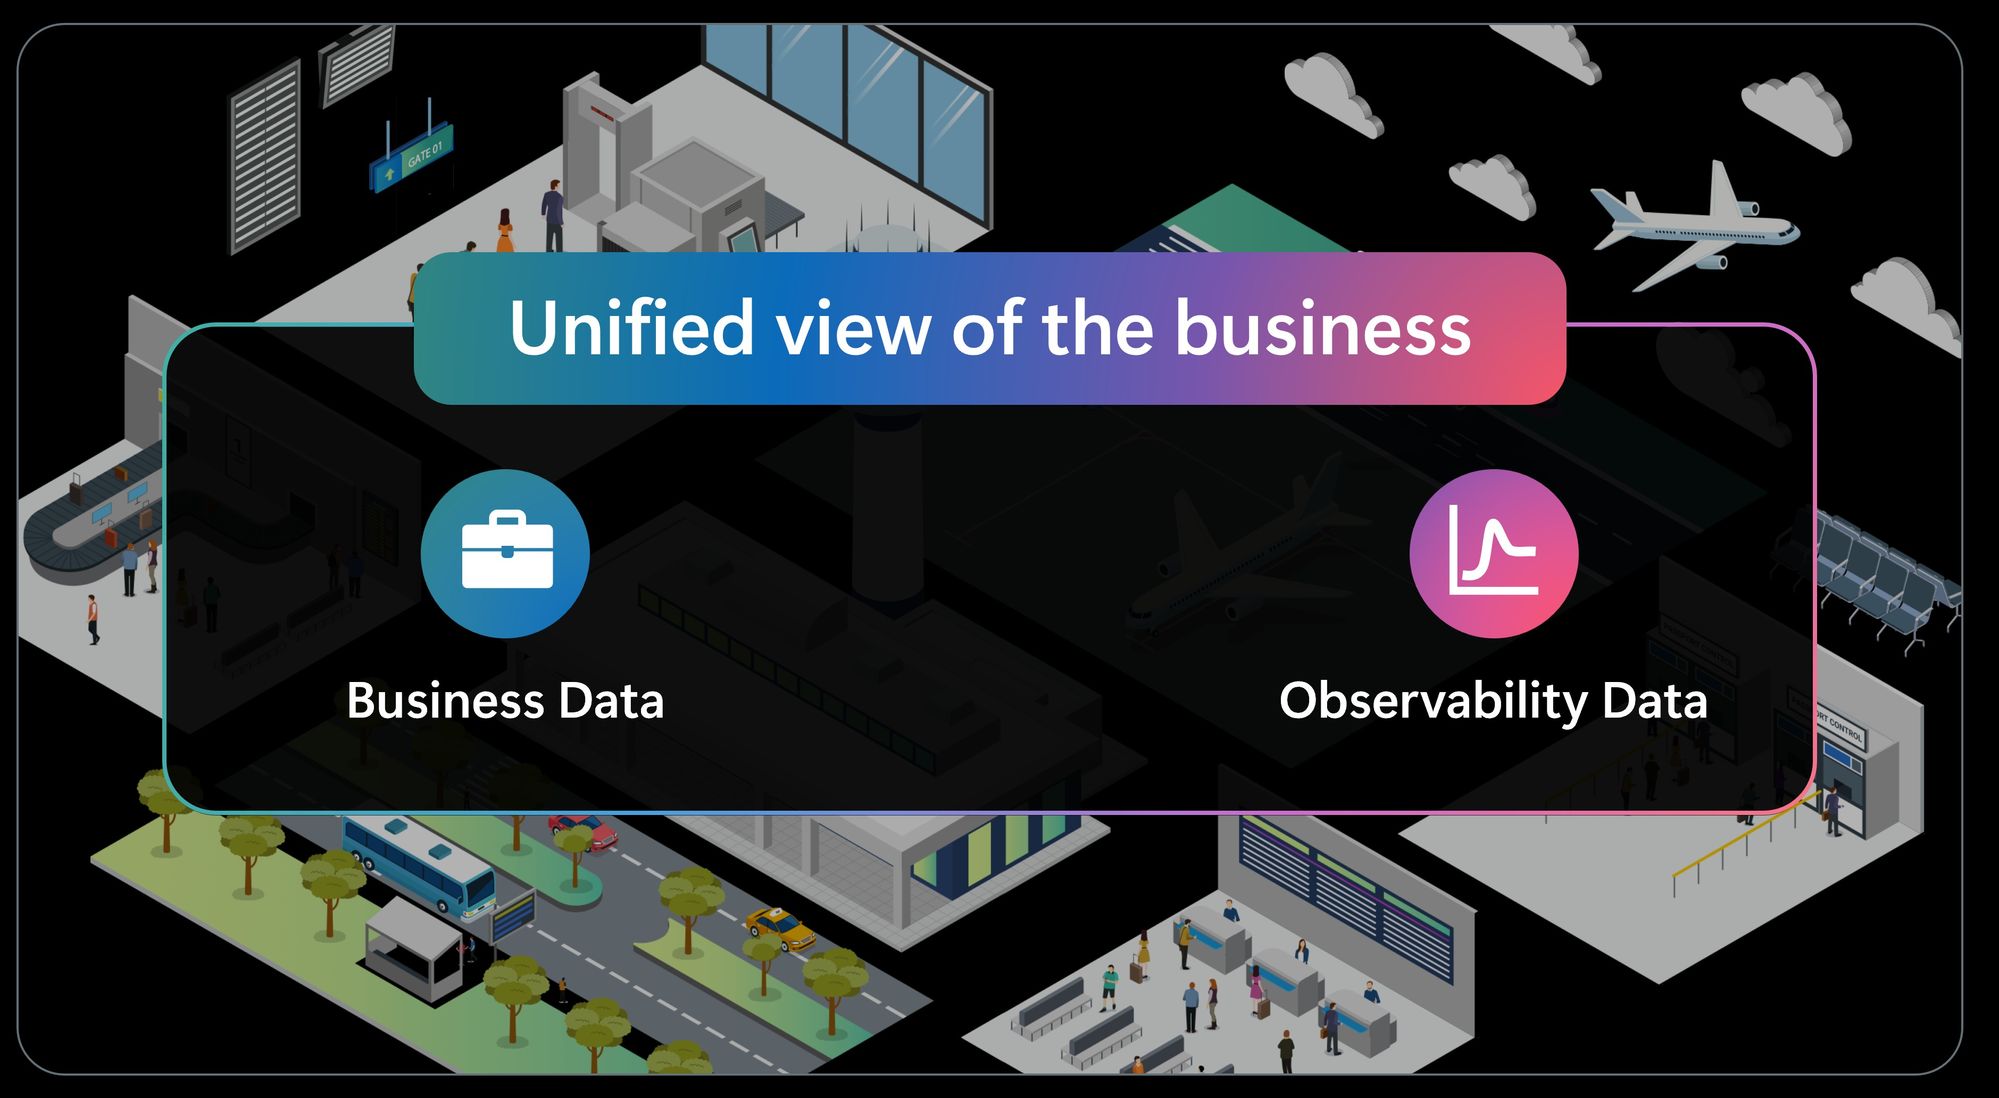
Share your Azure Monitor Logs to Microsoft Fabric in Delta Parquet, analyze them with the full breadth of Fabric, and turn signals into business action.
Azure Monitor Logs sharing to Microsoft Fabric is now in public preview. In just a few steps, you can share the logs you already send to a Log Analytics workspace with OneLake in Delta Parquet—the open format—without duplication, at no additional cost. This opens your observability data to all analytics, data science, and business intelligence tools available in Fabric.
Today, observability, operational, and business data often live in separate silos. While Microsoft Fabric already provides a unified foundation in OneLake for business and operational data, observability data is frequently disconnected—hard to reach with the broader tools of your data estate, and disconnected from the business context needed to act. Sharing Azure Monitor data to Microsoft Fabric closes these gaps. Let's see how:
Open format: your logs as Delta Parquet in OneLake
In just a few steps, you can share every log you send to a Log Analytics workspace—across all tiers, including Analytics, Basic, and Auxiliary—to OneLake as Delta Parquet. Once setup completed, telemetry is available in Fabric without duplication, at no additional cost, and with near real-time availability. Because Delta Parquet is an open standard, you can read the same data with any engine that understands it—no proprietary export, no copy to maintain.
Bring the full breadth of Fabric analytics to your telemetry
With your logs in OneLake, you can apply the full range of Fabric analytics to your telemetry.
Examples of what you can do:
- Build Power BI reports over long-term telemetry for trend analysis and reporting.
- Run Spark for large-scale processing, machine learning, and analysis across long ranges of historical telemetry.
- Query and correlate telemetry alongside operational and business data in one place—we'll explore this further in the next section.
Going further: cross-domain intelligence
The biggest shift comes when observability data is combined with business context and acted on in near real time. By bringing Azure Monitor telemetry together with business data such as ERP and CRM, organizations can reason and act across domains as events happen:
- Signals are evaluated with full business context, not as isolated alerts—so you can see who and what is affected, and how much it's costing.
- Signals turn into operational and business action—triggering the right response to mitigate the business impact of incidents before it grows.
.
Scenario in action: airport check-in disruption
At Zava Airport, self-check-in kiosks stream telemetry into Azure Monitor. Following a deployment issue, customers are unable to complete self check-in.
The Fabric Operations Agent detects the problem, enriches it with business context from ERP and CRM systems, and helps Vic, the operations manager, quickly understand that high-value loyalty customers are affected and that operational costs are rising. Based on this context, Vic approves the Operations Agent’s recommendations to open a dedicated counter to reduce customer impact and to escalate the issue to IT for faster resolution, given the high business impact.
Instead of reacting after the fact, she makes decisions in the moment, based on full business context.
Learn how organizations can move from operational signals to business action:
So how is this powered in Fabric?
Behind the scenes: how it's built in Fabric
This experience runs on a simple, unified setup in Fabric:
- Azure Monitor data in OneLake — Telemetry from the Log Analytics workspace is brought in through a Mirrored Azure Monitor item, without duplication.
- Cross-domain data ready in Eventhouse — Telemetry and business data such as ERP and CRM are made available in one place, ready for real-time analysis and action.
- Real-time analytics and action — A Real-Time Dashboard and the Operations Agent run on this combined data, triggering automated actions across systems.
Together, this creates a continuous flow from data to insight to action on a single data foundation.
Learn how this solution is built in Microsoft Fabric:
Key takeaways
- Multiple data domains, unified in OneLake — In a few steps, you can share your Azure Monitor Logs, across all tiers, to OneLake as open Delta Parquet, without duplication and at no additional cost.
- Full Fabric analytics — Power BI, Spark, and machine learning apply directly to your telemetry, alongside your business data.
- Real-time cross-domain intelligence — Observability and business data are reasoned about together in seconds, not passed sequentially between teams.
- Drive action, not just reports — The system detects, decides, and triggers actions based on all available context.
Looking ahead...
Fabric IQ and Ontology will further enrich the experience by helping organizations model business entities and relationships across domains, enabling even deeper understanding of business context.
Next steps
Explore how Azure Monitor data and business data come together in Microsoft Fabric to enable cross-domain intelligence, analytics, and action.
We'd love to hear how this experience works for you. Drop us a comment or reach out to azmon-in-fabric@microsoft.com. Your input directly shapes what comes next.

 Microsoft