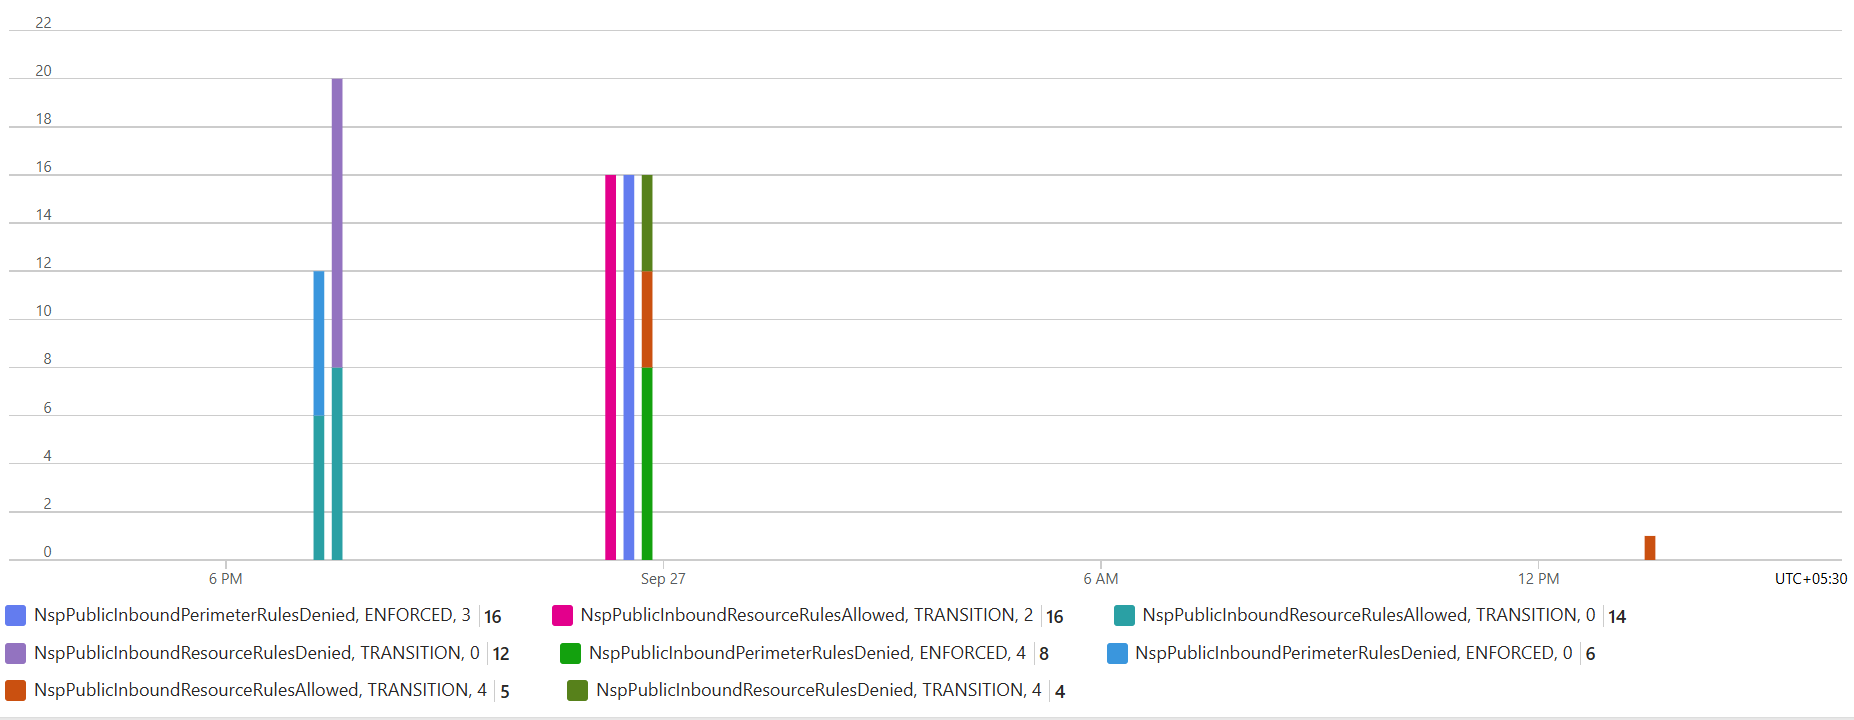
This is an announcement of general availability of network security perimeter metrics available through Azure Monitor in Public Cloud, enabling administrators to monitor access patterns, track approved and denied requests, validate access-rule changes, detect unexpected traffic, and create dashboards and alerts.
We are excited to announce the general availability (GA) of network security perimeter metrics, a capability that helps administrators monitor network access patterns, understand the impact of the access rules, and identify unexpected traffic behaviour across protected resources. These metrics are available through Azure Monitor and can be used to create dashboards, alerts, and operational monitoring experiences.
Why use network security perimeter metrics?
Network security perimeter metrics capture access requests evaluated by the data plane and provide visibility into network activity associated with the perimeter-protected resources. Metrics enable monitoring scenarios such as:
- Tracking approved and denied access requests.
- Monitoring inbound and outbound access activity.
- Understanding traffic patterns across protected resources, profiles, access modes and access rule versions.
- Detecting unexpected access attempts.
- Validating the impact of access rules’ changes.
- Establishing a baseline before moving a perimeter from Transition mode to Enforced mode.
Network security perimeter metrics render aggregated time-series data that is optimized for monitoring, alerting, and trend analysis.
Accessing network security perimeter metrics
Network security perimeter metrics are available through Azure Monitor.
- In the Azure portal, navigate to your network security perimeter resource.
- Select Metrics under the Monitoring section.
- ‘Add Metric’
- Choose the ‘NSP access metrics’ namespace.
- Select a metric and configure filters, splitting as needed.
- Use Azure Monitor features to build charts, dashboards, workbooks, and metric alerts.
- Multiple charts may be created for different metrics that are intended to be monitored.
Regular Azure Monitor features like drilling into the logs, saving the chart as a dashboard or exporting it to a workbook can also be performed.
Metrics vs diagnostic logs
While metrics and diagnostic logs are complementary monitoring tools, metrics provide a high-level operational view and support alerting, while diagnostic logs provide detailed event data for troubleshooting and investigation. Table below gives a high-level differentiation view of one over the other.
|
Capability |
Metrics |
Diagnostic logs |
|
Trend analysis |
Yes |
Limited |
|
Dashboards and visualizations |
Yes |
Requires log queries |
|
Azure Monitor metric alerts |
Yes |
No |
|
Detailed request information |
No |
Yes |
|
Forensic investigations |
No |
Yes |
|
Operational monitoring |
Yes |
Yes |
|
Readibility |
Instant |
Destination needed |
|
Cost implications |
Free |
Chargeable destinations |
Reach-out to mailto:nsppmvteam@microsoft.com for any questions.

 Microsoft