Forum Discussion
idontknowanything
Jul 29, 2022Copper Contributor
Monthly incident bar graph
Hello,
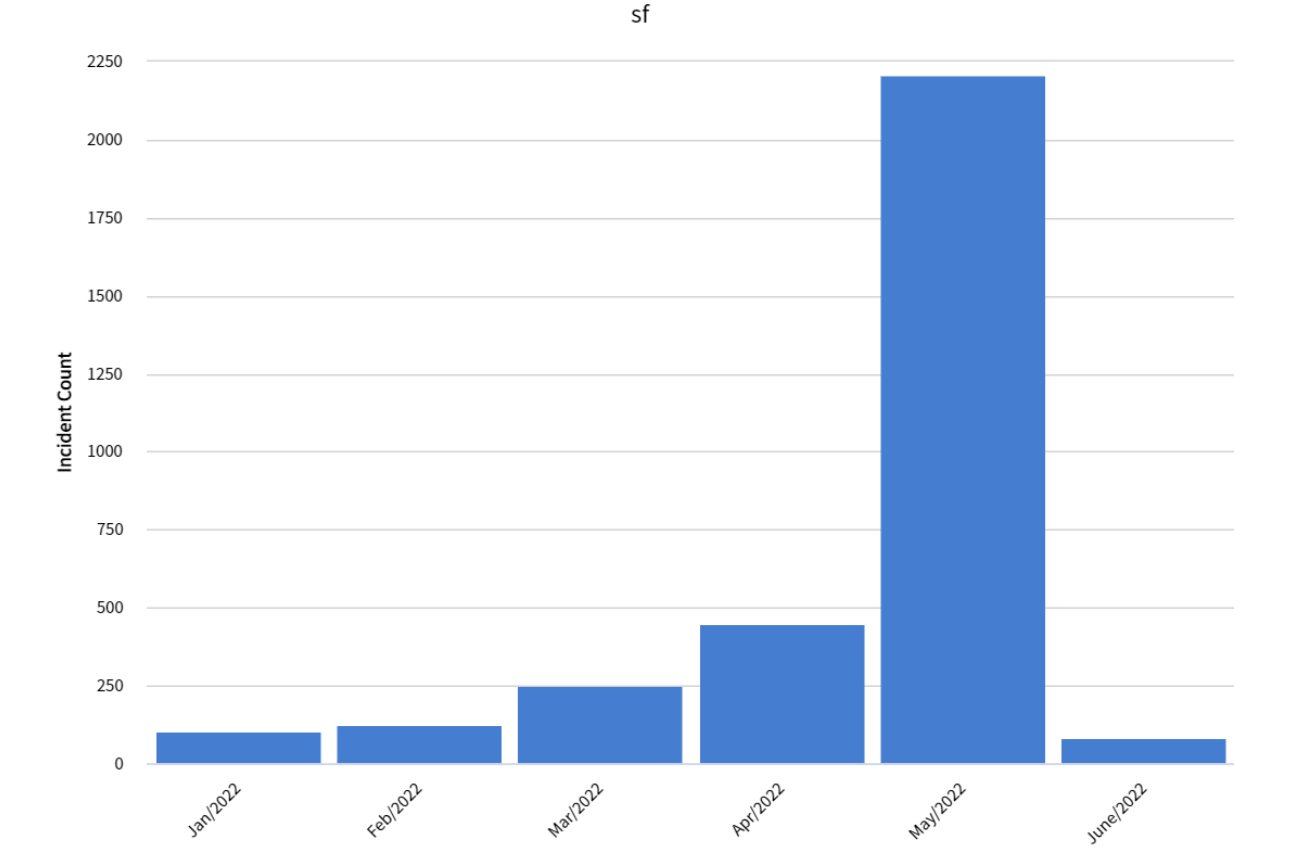
I'm trying to create a bar graph for total number of incidents that were generated in the last 6 months. Something like the attached image. Is it possible to create that in sentinel?
Thank you in advance!
SecurityIncident
// get logs for previous n months
| where TimeGenerated between(startofmonth(now(),-7) ..endofmonth(endofmonth(now(),-1)) )
| extend yy = datepart("Year", TimeGenerated)
| extend mm = datepart("Month", TimeGenerated)
| summarize count() by month=bin(datepart("Month", TimeGenerated), 1), tostring(yy), mm
// format month so we can sort it
| extend month = case(month==1,strcat('Jan/',yy),month==2,strcat('Feb/',yy),month==3, strcat('Mar/',yy),month==4,strcat('Apr/',yy),month==5,strcat('May/',yy),month==6,strcat('Jun/',yy),month==7, strcat('Jul/',yy),month==8,strcat('Aug/',yy),month==9,strcat('Sep/',yy),month==10,strcat('Oct/',yy),month==11,strcat('Nov/',yy),month==12,strcat('Dec/',yy),"error")
| order by yy asc, mm asc
| project-away yy,mm
| render columnchart title='Incident by Month'
5 Replies
- Clive_WatsonBronze Contributor
Alter line #3 if you need more that 6 months or if you want to include the current month (-1 is to exclude the current month, use -0 if you need the "month to date" ).
You can alter line #6 to get the date format you require.SecurityIncident // get logs for previous n months | where TimeGenerated between(startofmonth(now(),-6) ..endofmonth(endofmonth(now(),-1)) ) | summarize count() by month=bin(datepart("Month", TimeGenerated), 1) // format month so we can sort it | extend month = case(month==1,strcat(month,'. Jan'),month==2,strcat(month,'. Feb'),month==3, strcat(month,'. Mar'),month==4,strcat(month,'. Apr'),month==5,strcat(month,'. May'),month==6,strcat(month,'. Jun'),month==7, strcat(month,'. Jul'),month==8,strcat(month,'. Aug'),month==9,strcat(month,'. Sep'),month==10,strcat(month,'. Oct'),month==11,strcat(month,'. Nov'),month==12,strcat(month,'. Dec'),"error") | order by month asc- Clive_WatsonBronze Contributor
SecurityIncident // get logs for previous n months | where TimeGenerated between(startofmonth(now(),-7) ..endofmonth(endofmonth(now(),-1)) ) | extend yy = datepart("Year", TimeGenerated) | extend mm = datepart("Month", TimeGenerated) | summarize count() by month=bin(datepart("Month", TimeGenerated), 1), tostring(yy), mm // format month so we can sort it | extend month = case(month==1,strcat('Jan/',yy),month==2,strcat('Feb/',yy),month==3, strcat('Mar/',yy),month==4,strcat('Apr/',yy),month==5,strcat('May/',yy),month==6,strcat('Jun/',yy),month==7, strcat('Jul/',yy),month==8,strcat('Aug/',yy),month==9,strcat('Sep/',yy),month==10,strcat('Oct/',yy),month==11,strcat('Nov/',yy),month==12,strcat('Dec/',yy),"error") | order by yy asc, mm asc | project-away yy,mm | render columnchart title='Incident by Month' idontknowanythingCopper ContributorThis is wonderful! Now I was wondering is there a way to add a line graph on top of this graph? The current bar graph is incidents. The line graph would be escalations to a certain user/group.
- Clive_WatsonBronze ContributorAdd a line #8 to render the chart (sorry I missed it off the sample above):
| render columnchart