Forum Discussion
How to create from Logs a chart in Metrics?
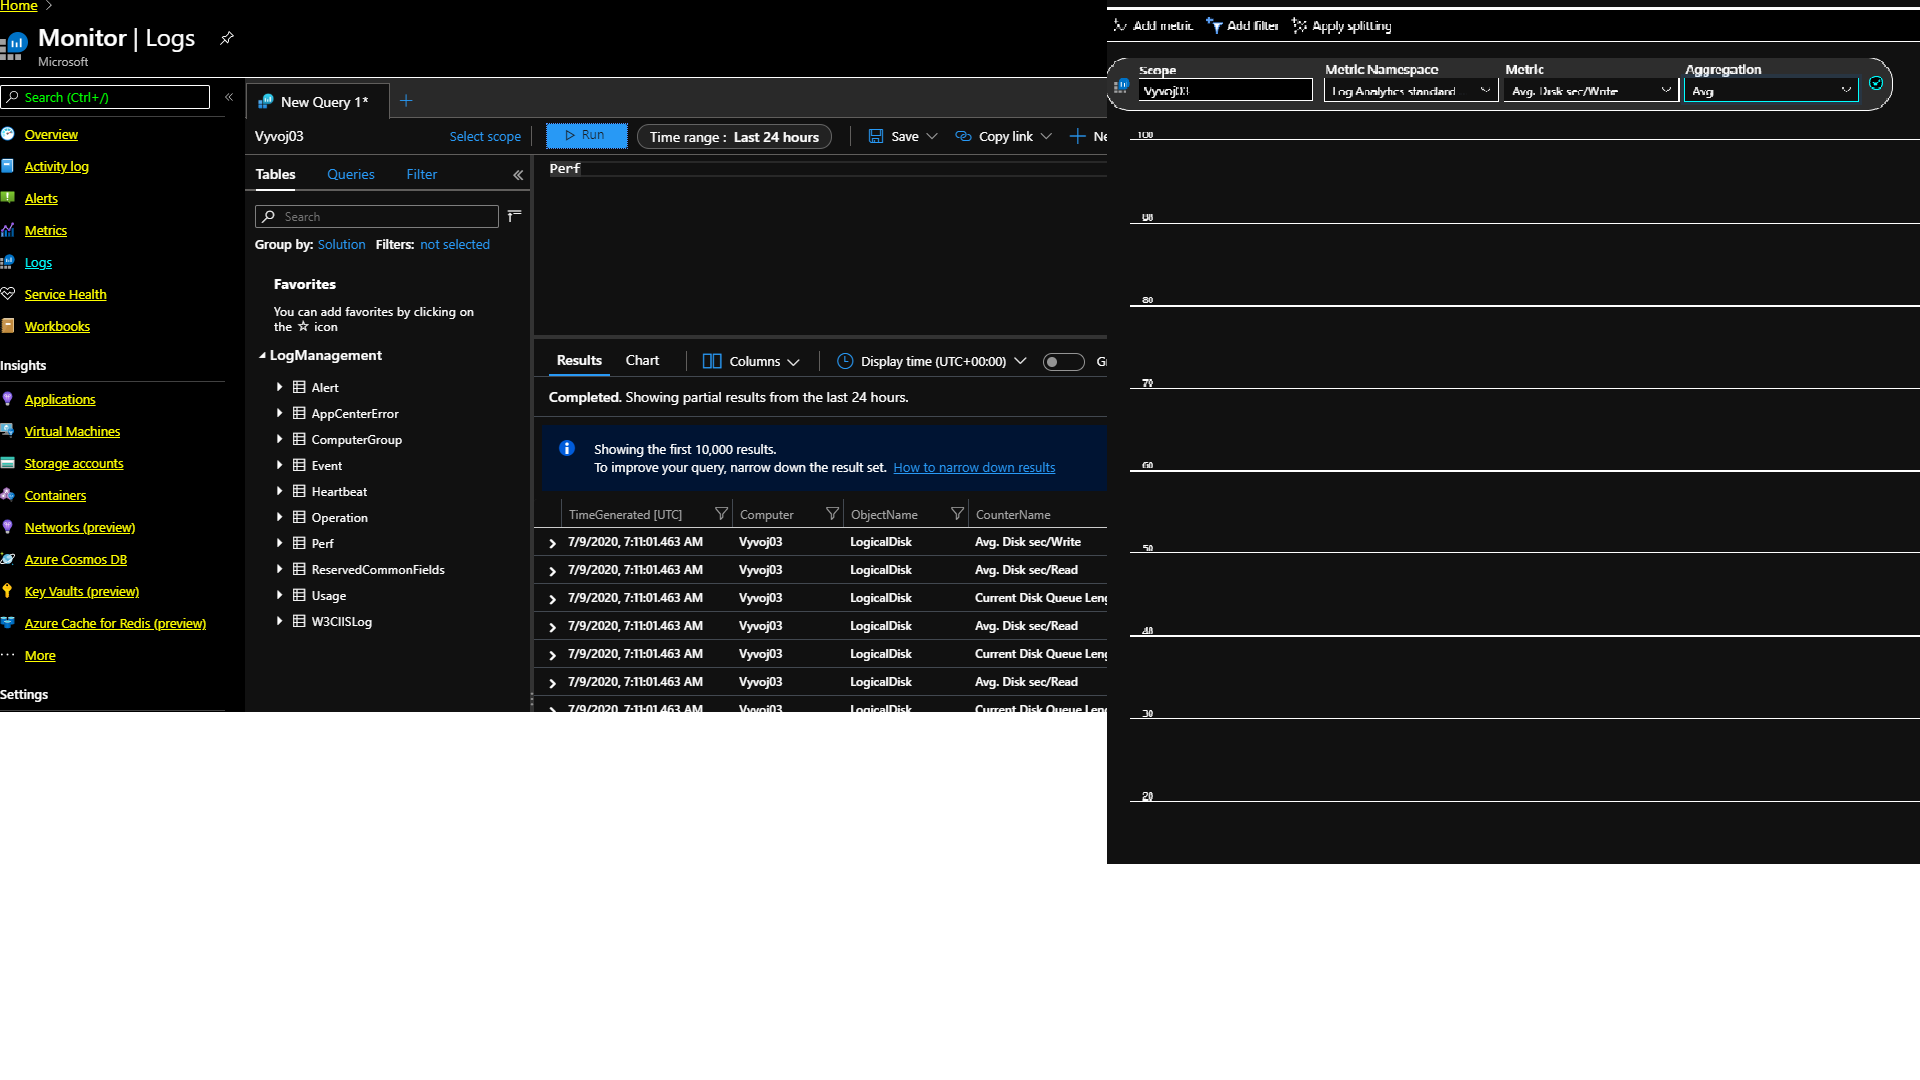
Its a little hard to see (maybe my eyesight) from your 5th picture, but its looks like you are trying to look at the metrics of the workspace rather than the resource (Virtual Machine). Swap the namespace to the metric you want to see.
If you look in the Overview: https://docs.microsoft.com/en-us/azure/azure-monitor/overview
Logs (where you have the PERF table are in "logs" workspace (one you setup and name), but Metrics are in another workspace (which you don't have to worry about...its provided top customers); so you can just look for the resource.
Hi, CliveWatson.
I think that my problem is
that I collect data only from Windows agent (Log analytics agent at on-promise OS Windows).
I do not collect data from other resources (like Azure VM and so on).
I find out the source
https://docs.microsoft.com/en-us/azure/azure-monitor/platform/data-platform#compare-azure-monitor-metrics-and-logs where is:
Data sources include:
Metrics: Platform metrics collected from Azure resources. Applications monitored by Application Insights. Custom defined by application or API.
Logs: Application and resource logs. Monitoring solutions. Agents and VM extensions.
Application requests and exceptions. Azure Security Center. Data Collector API.
Thank you for reply.