Forum Discussion
Jhilene Microsoft
Jul 27, 2020MicrosoftHow do I put the threshold reference line on the X-axis?
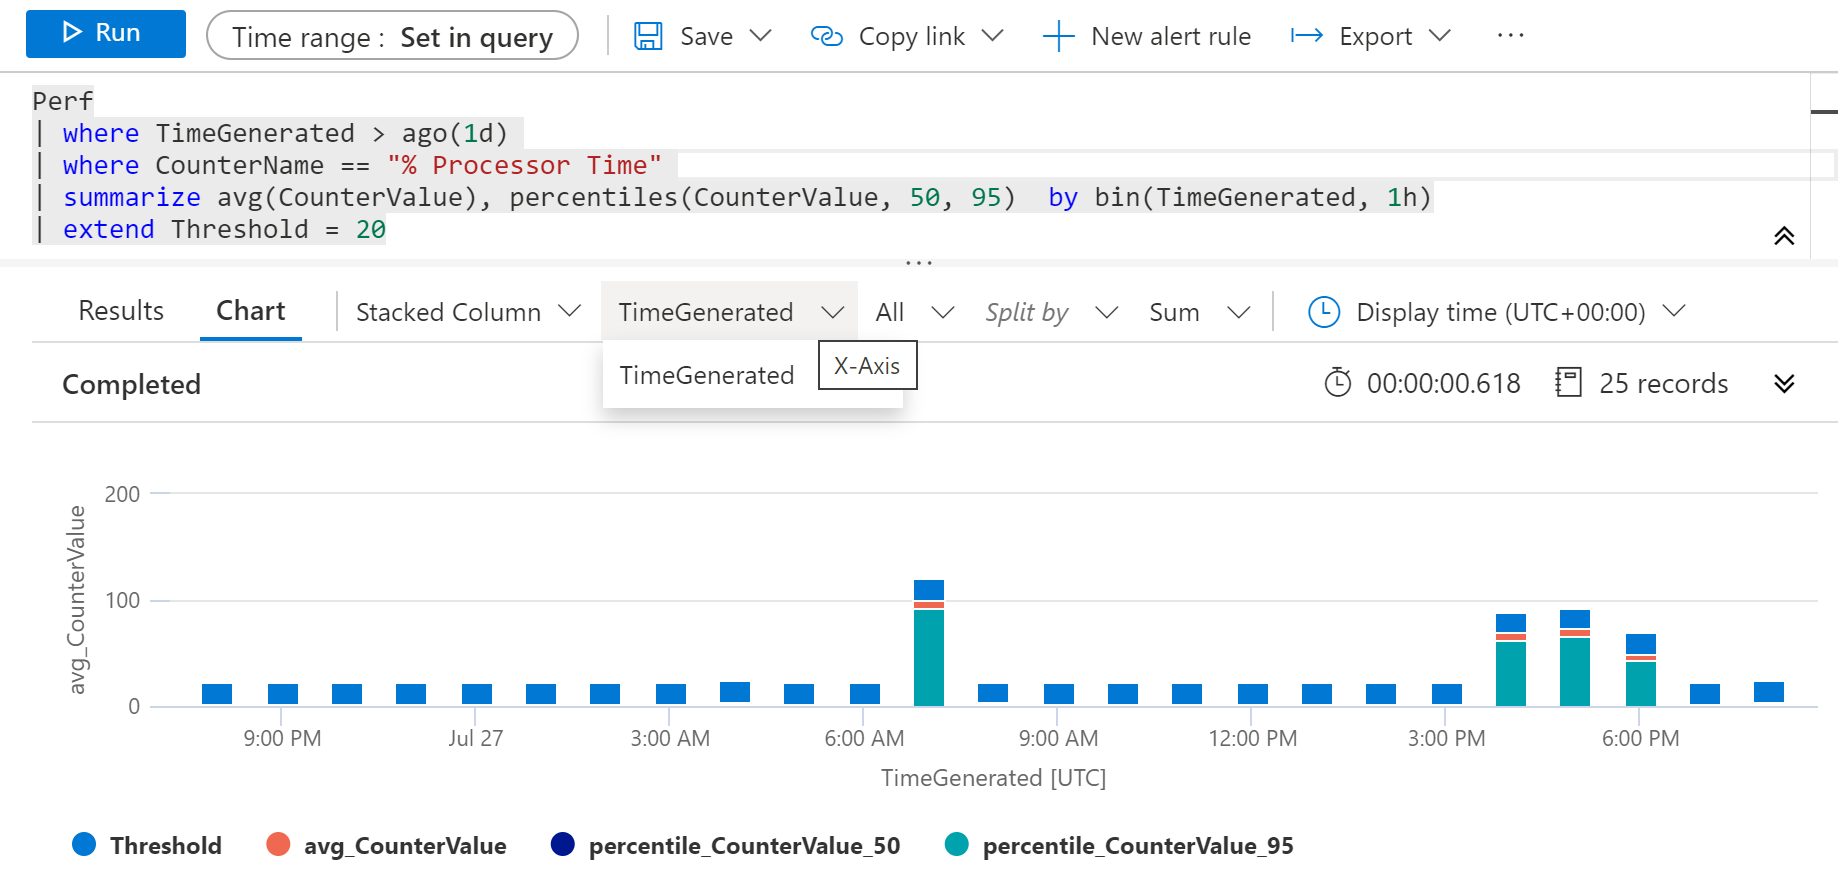
I am trying to place a threshold line on the x-axis using this query
Perf
| where TimeGenerated > ago(1d)
| where CounterName == "% Processor Time"
| summarize avg(CounterValue), percentiles(CounterValue, 50, 95)  by bin(TimeGenerated, 1h)
| extend Threshold = 20
However, it is not giving me the option to have 1 threshold line on the x axis. It's called a "reference line", according to this tutorial: https://docs.microsoft.com/en-us/azure/azure-monitor/log-query/charts
I've attached an image.
3 Replies
 JhileneAnyone? I've been blocked by this all day. No answers anywhere.
- CliveWatsonFormer Employee
This shows up best with a linechartPerf | where TimeGenerated > ago(1d) | where CounterName == "% Processor Time" | summarize avg(CounterValue), percentiles(CounterValue, 50, 95) by bin(TimeGenerated, 1h) | extend Threshold = 20 | render timechart- Jhilene
CliveWatson I see it does, but I do not understand how alerts graph is able to do it with a bar graph https://docs.microsoft.com/en-us/azure/azure-monitor/platform/alerts-log