Forum Discussion

How to create a active bugs trend chart

Hi Mauricio,
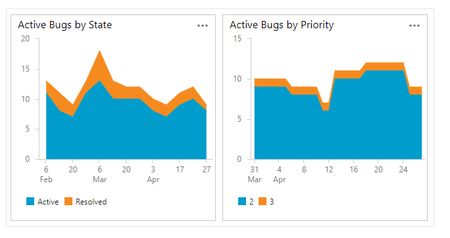
As you observed, that is a cumulative chart - its does not display only the active bugs, but all the accumulated bugs along the time.
You can easily get a chart like that by using the WIP Run Chart widget provided by the Great Gadgets extension (see https://dev.azure.com/stonikbyte-production/Great%20Gadgets/_dashboards/dashboard/0329cfac-11f7-4bf6-8959-f8c13fedb181).
To obtain such chart:
1. create a shared query that returns all the bugs from your projects/teams (including the closed bugs)
2. add the WIP Run Chart widget to an Azure DevOps dashboard and configure it to use the created shared query
3. On Data tab configure its time range, calculation by work count. If needed, select the 3rd option Work Items in one of these states and select the workflow states that you want to include in the chart.
4. On More Settings tab choose to Split data by State
Hope this helps.
D.