First published on CloudBlogs on Mar, 14 2012
The Configuration Manager console has been greatly improved in System Center 2012 Configuration Manager, which enhances its usability. In addition to improvements in performance and layout, the console now supports a quicker way to monitor application deployments.
However, you might come across a situation where you see a discrepancy between the completion statistics section for an error count of a deployment and the Error tab of the deployment status when you drill into the status of the deployment. In this scenario, you see the following:
- The count of assets that returned an error state when you review the completion statistics of a deployment do not match the number of assets that are listed in the Error tab of the Deployment Status .
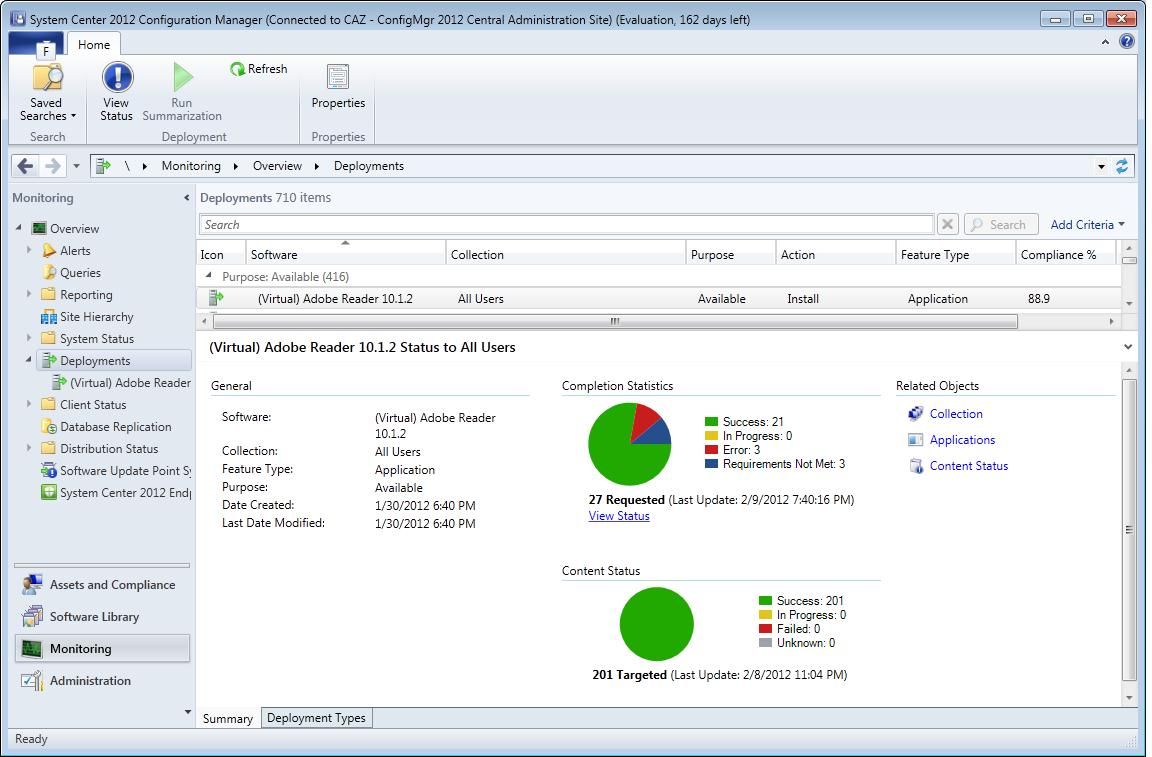
For example, the following screenshot shows that the completion statistics for the deployment displays 3 assets that have reported an error ( Error: 3 ).
But when you click View Status to drill into the status of the deployment and then click the Error tab, there is only 1 asset that is displayed with an Error state, as shown in the next screenshot:
This mismatch can be a result of a few different types of client-side errors that are not related to the deployment’s purpose. The error generated by the asset is included within the deployment purpose, but the error is not in the deployment type results that are used to display summarized data.
These types of errors include Microsoft Policy Platform errors, SMS Provider errors, and possibly invalid requirement rules.
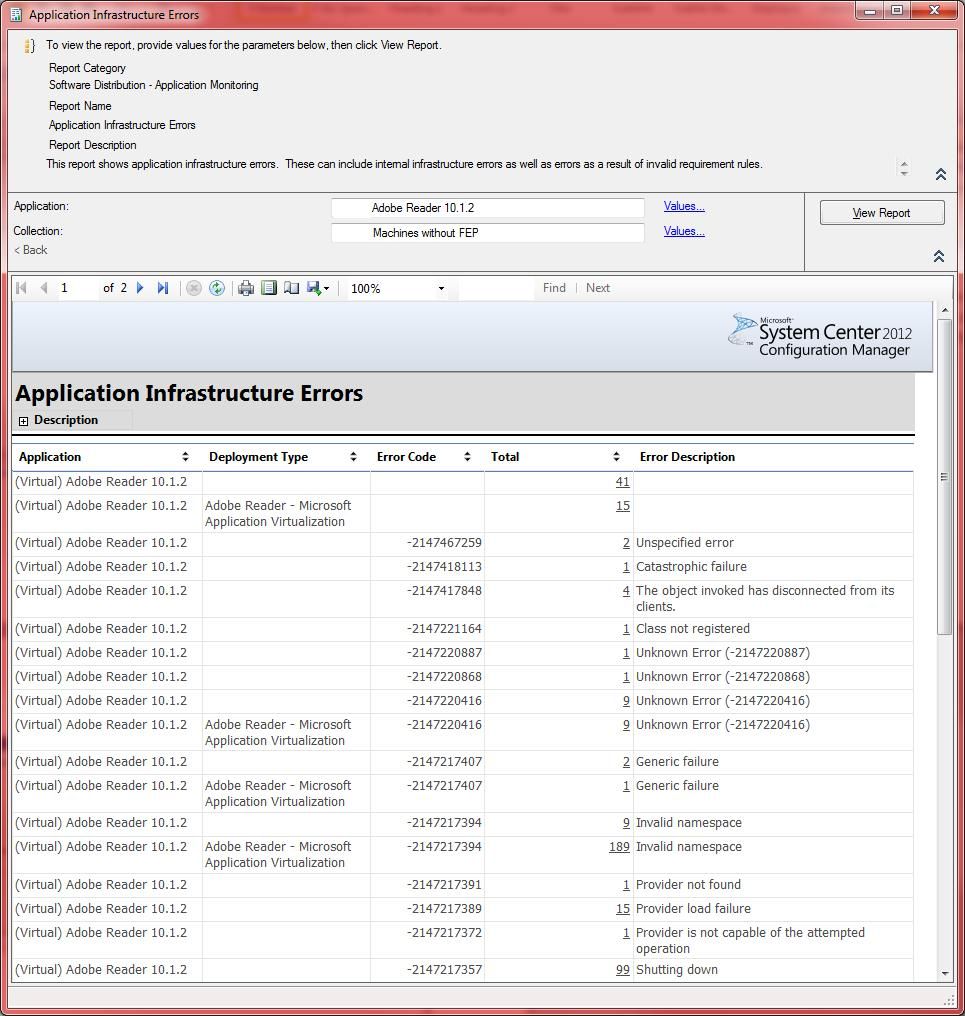
To determine which assets have returned errors but are not listed in the Error tab of the Deployment Status, run the Application Infrastructure Errors report. You’ll find this report in the Software Distribution – Application Monitoring folder in the Reporting node in the Monitoring workspace. This report lists the assets and the error that was generated, which will help you troubleshoot the problem. This report does not list assets that have returned errors that are displayed in the Monitoring workspace of the Configuration Manager console.
When you enter or select the application name and the collection you want to run the report against, you’ll see what errors are reported and a count of the assets (in the column Total ) that have returned that specific error. See the next screenshot as an example.
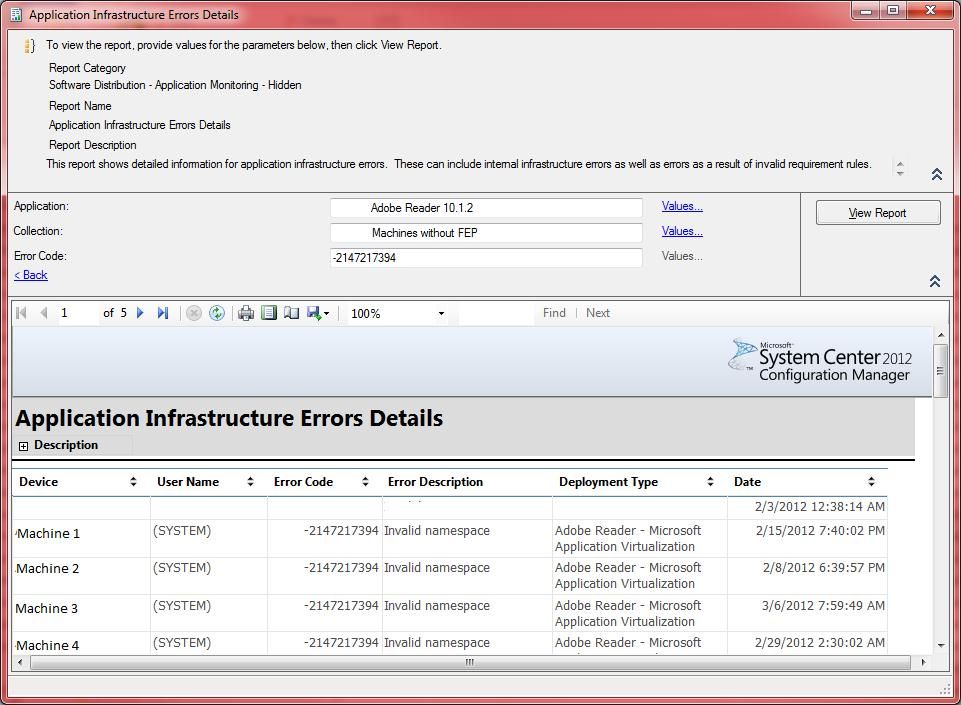
You can click on the Asset count (in the Total column) to drill into the Application Infrastructure Errors Detail report to get the list of specific assets that have returned that error code. The following screenshot shows example data.
Summary:
- You might see a targeted asset return an infrastructure error that is counted in the Deployment Error Summary total but that is not displayed in the Error tab of the Deployment Status.
- If this situation occurs, run the Application Infrastructure Errors report to determine the asset and error that was returned.
For more information about application management in System Center 2012 Configuration Manager, see Application Management in Configuration Manager in the System Center 2012 Configuration Manager Documentation Library.
-- Michael Wray
This posting is provided "AS IS" with no warranties, and confers no rights.
Published Sep 08, 2018
Version 1.0yvetteomeally Microsoft
 Microsoft
Joined August 30, 2016
Microsoft Security Blog
Follow this blog board to get notified when there's new activity


