One of the advantages of having the Endpoint Protection and Configuration Manager data integrated into a single database in Configuration Manager 2012 is that it simplifies building custom reports. Though we offer over 400 total System Center 2012 Configuration Manager reports out-of-box, there will certainly be scenarios where you’ll need your own reports.
For example, we offer 6 primary out-of-box Endpoint Protection reports, but with the amount of data available from both management and security data-points, you will undoubtedly want to create custom reports tailored to your organizational needs. I’m going to cover an example of how you can build a custom-report for last antimalware scan-time using available System Center 2012 Configuration Manager and Endpoint Protection data, Report Builder 3.0, and the reporting point with SQL Reporting Services. Here we go.
Getting started
The example we’re going to run through is creating a simple table that shows start and finish times for both quick and full antimalware scans, with a date-based variable so you can see just clients with a scan-date older than the date you specify. Also, we’re going to add the computer name, and operating system version to show how easy it is to join data across Configuration Manager and Endpoint Protection views.
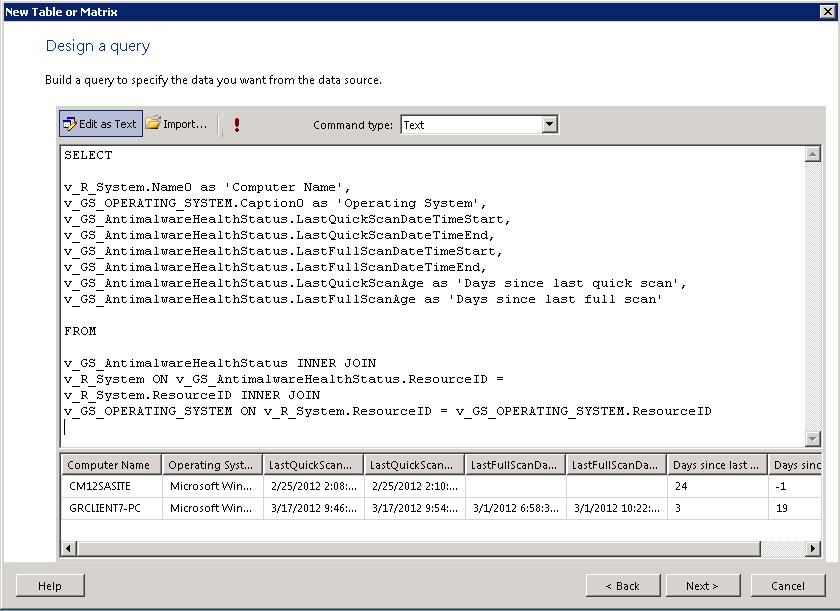
The first step in creating the report is to build the base query from which you’ll derive the data. Though you can build the query logic directly in Report Builder, I find it’s easier to just build the query through SQL Server Management Studio. There’s just more “elbow room” there, and you can cheat and use the graphical Design Query in Editor to simplify cross-view joins if you need to. In this query we’re joining three different views to get the computer name, OS, and last quick/full scan times. A note on using views vs. tables—we recommend using views wherever possible for performance reasons and to honor RBA on reports relative to console-rights granted.
Query for Last Scan Times
*One other note for building other custom reports using client data, you can always use ResourceID when doing cross-view joins.
Creating the custom report using Report Builder 3.0
Using Report Builder 3.0*, with a few easy steps, you can easily create this custom report and publish it for viewing as a Configuration Manager reporting. I’ll walk through the basic steps, of launching Report Builder 3.0 to create the SRS report, connecting to your data source, adding the query from the previous step, customizing the look and feel of the report, and publishing the report to SRS.
Note: For more details about using Report Builder 3.0, refer to this TechNet article. This is intended as a high-level getting-started guide, but the referenced link provides a lot more examples of the awesome things you can do with the tool.
* Report Builder 3.0 comes with the latest version of SQL 2008. System Center 2012 Configuration Manager uses Report Builder 2.0 when launched from the Configuration Manager console. The report building experience is very similar, however.
- From the reporting home page on your Configuration Manager reporting point server launch Report Builder 3.0:
-
Click New Report , and then click Table or Matrix Wizard .
-
Create a dataset
-
Choose a new data source, , in the Data Source Properties dialog box, choose Build, and then select your Configuration Manager database server name, and the Configuration Manager database.
-
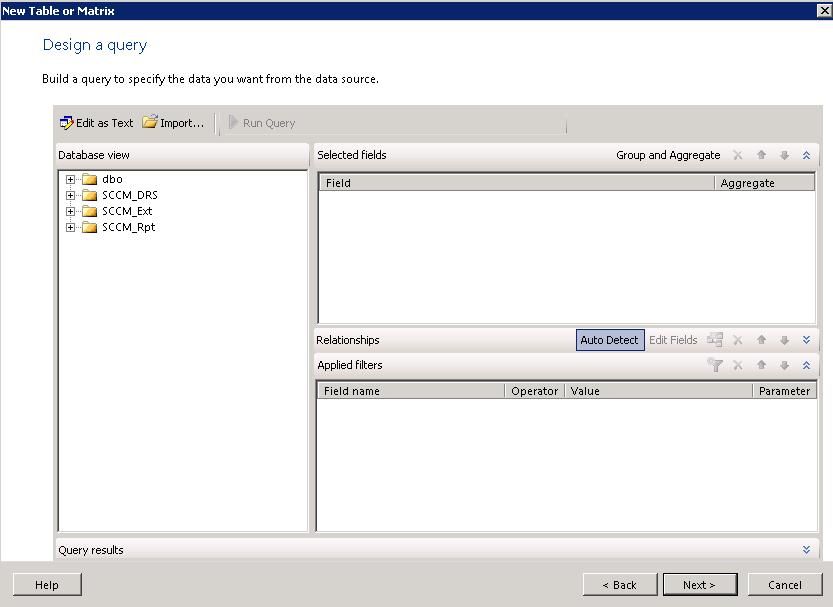
On the Design a query page, select Edit as Text . Note: you can also open an existing Configuration Manager report from this page as well, if you want to use one of those as a starting point for your own custom report.
-
Paste the query you created in SQL Server Management Studio (or you can import .SQL or .RDL files directly). Click the red ! to test your query.
-
Add a the following WHERE expression to the end of your query, which allows you to pass a date variable in the report so you can constrain the report to just computers that have not performed a Quick Scan since a particular date
-
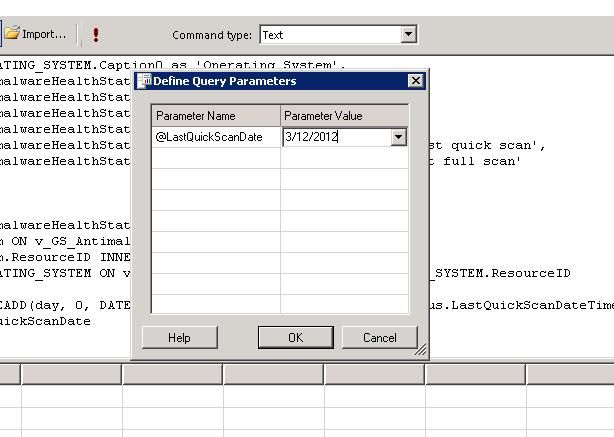
Click the red ! again to test your query and add a date when prompted:
-
If your query returns the expected results then you’re good to move forward, so hit Next . If you don’t see results, go back to SQL Query Analyzer and make sure that your query actually returns results there and/or review any errors returned by Report Builder when executing the report.
-
On the next screen, you arrange the fields, which will serve as the basis for your report. In the example, the rows will be derived from individual Computers by ‘Computer Name’ and the values for each ‘Computer Name’ will be built from the other query rows, such as below. Once you get these set, go ahead and click Next .
-
Next you choose the layout. For a simple report like this, you can go ahead and uncheck Show subtotals and grand totals , and Expand/Collapse groups as they don’t really add anything interesting in this context. After de-selecting those, click Next .
-
Now you’re on the design screen, where you can do things like add titles, expand columns, and add other built-in fields (like paging and numbering). Let’s just do a couple of simple things here to make the report easier to read. First, expand the columns out so the full header is readable. Then add a title, for example, “Clients that have not run a quick scan since:” and then just because we can, add a control to show the date you set in the variable next to the title. This control will show the variable date string entered when the report is run to highlight this value in the report title, so if it’s exported, viewers will know what they’re looking at.
-
Once you get the format set how you want it, click the Run button in the ribbon, and you’ll see the report just as an admin launching it from reports viewer would.
-
From this view, enter a date into the variable box (such as 3/12/2012) and click View Report , which will display the report like this:
-
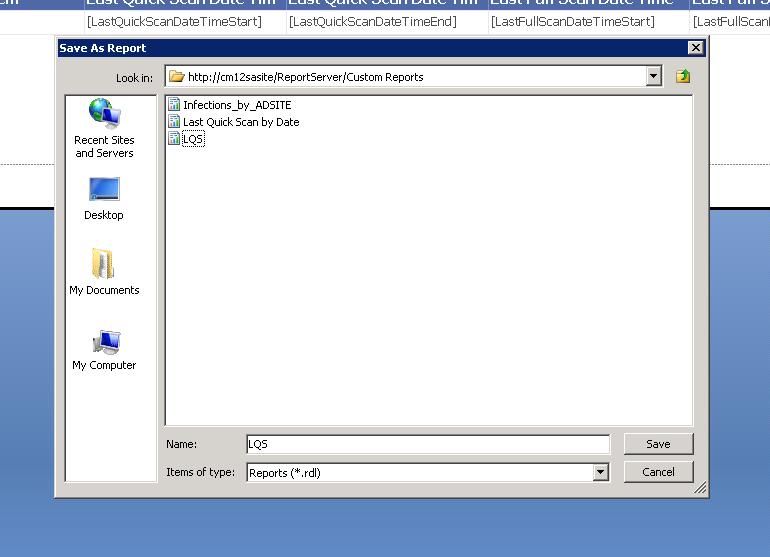
To publish the reports, simply return to the design view (from the ribbon), and save the report. Create or select a folder, and then click Save .
-
After the report is saved, go to the reporting link in your browser, and you’ll see the new custom report displayed. Go ahead and launch it to try it out as well.
Wrapping up
So that’s just one simple of example of how you can take advantage of the rich Configuration Manager and Endpoint Protection database to create a custom report for your organization. There are thousands of report possibilities so you just need to decide what your organization needs, and use this process to start creating valuable reports. Also, you can open existing Configuration Manager reports with Report Builder, to serve as a foundation for queries you might want to use in your own custom reports. Report Builder also allows you to integrate pieces of various reports to get precisely the data you want on the same page. So go make some awesome reports and show them off to everyone. Post them so we can all get the value and learn from you, and put the links to your creations in this blog. Thanks, and good luck!
This posting is provided "AS IS" with no warranties, and confers no rights.
 Microsoft


