This article demonstrates a solution: a lightweight Python collector that polls the Batch REST API for per-node data, sending it to Log Analytics Workspace. This enables precise KQL queries and targeted alerts for nodes stuck in bad states.
1. The problem (a real customer scenario)
Some of our customers described that they have those underlying gaps:
|
Symptom |
What the customer wanted |
|
Nodes intermittently stayed in the leavingpool state for hours. The customer needed to know which node was stuck and for how long, so an alert could fire only after a threshold (e.g. > 60 minutes). |
A dashboard/query that isolates one node at a time and calculates its duration in the current state. |
|
A node was reported unusable because the underlying OS provisioning failed. The customer needed automated detection to remediate (drop the pool to 0 and back up) instead of catching it manually. |
A per-node feed that carries state + error code + IP, so an alert can identify the offending node and its error. |
In both scenarios we recommended the same workaround which was: Build a small app that polls the Batch REST API for (per-node data) and stores it.
In this Article we will build this implementation as a reusable component and show the query and alert that would solve similar problems.
2. Why the platform cannot show this directly
- The main issue came from the fact that Azure Monitor metrics tools don't provide granular, node-level tracking out of the box (no 'NodeId' or 'PoolId'). Instead, it has a rich metrics that can help monitoring the Batch accounts (see the full metrics).
- All those metrics are single integers for the whole account. The "Split-by" filter in the portal Metrics blade lists no options for these two metrics so the customers can't filter down into a specific node's status.
- While AzureDiagnostic logs successfully show events at the pool level (example: 'PoolResizeCompleteEvent' or 'PoolResizeCompleteEvent'), they don't show state-change events for individual nodes. The current schema simply doesn't contain a 'NodeStateChange' row, meaning old KQL queries looking for this event will return zero results.
In summary, using the current Azure monitor metrics can tell you that "3 nodes are leaving," which answers your "What" question.
But if you are asking "Who" are leaving, you won't get a direct answer.
The good news that this trivial question will be answered in that article ✌️
3. The solution
The solution is mainly divided in 2 parts:
1- What we can expose from Azure and build on top of:
As mentioned before, the Azure Batch REST API returns rich per-node data via GET /pools/{poolId}/nodes (check the sample response). The most relevant fields are: (state, schedulingState, stateTransitionTime, errors[], startTaskInfo, ipAddress, allocationTime, lastBootTime) that we will use them in the collector (2nd part of the solution).
2- A small polling collector
This is a python script runs on a schedule.
1- It calls List pools + List Nodes, and posts each snapshot as a row in the Log Analytics custom table "BatchNodeInventory_CL" which is retained by Log Analytics Workspace "LAW" standard retention.
2- It authenticates against the Batch service. In a production environment, this is securely handled using a Managed Identity (MI), meaning no hardcoded passwords or keys are required.
But in my repro, it simply uses a token generated via the CLI command:
az account get-access-tokenThe core loop is:
token = aad_token("https://batch.core.windows.net/") for pool in GET /pools: for node in GET /pools/{pool.id}/nodes: row = { TimeGenerated, PoolId, NodeId, State, SchedulingState, StateTransitionTime, VmSize, IpAddress, IsDedicated, RunningTasks, TotalTasksRun, ErrorCount, ErrorCode, ErrorMessage, StartTaskState, StartTaskExitCode, AllocationTime, LastBootTime } rows.append(row) post_to_law(rows)You can find the full script here: node-state-collector.py
5. The query that answers the customer's question
Now, our customers' questions became just a query 😉
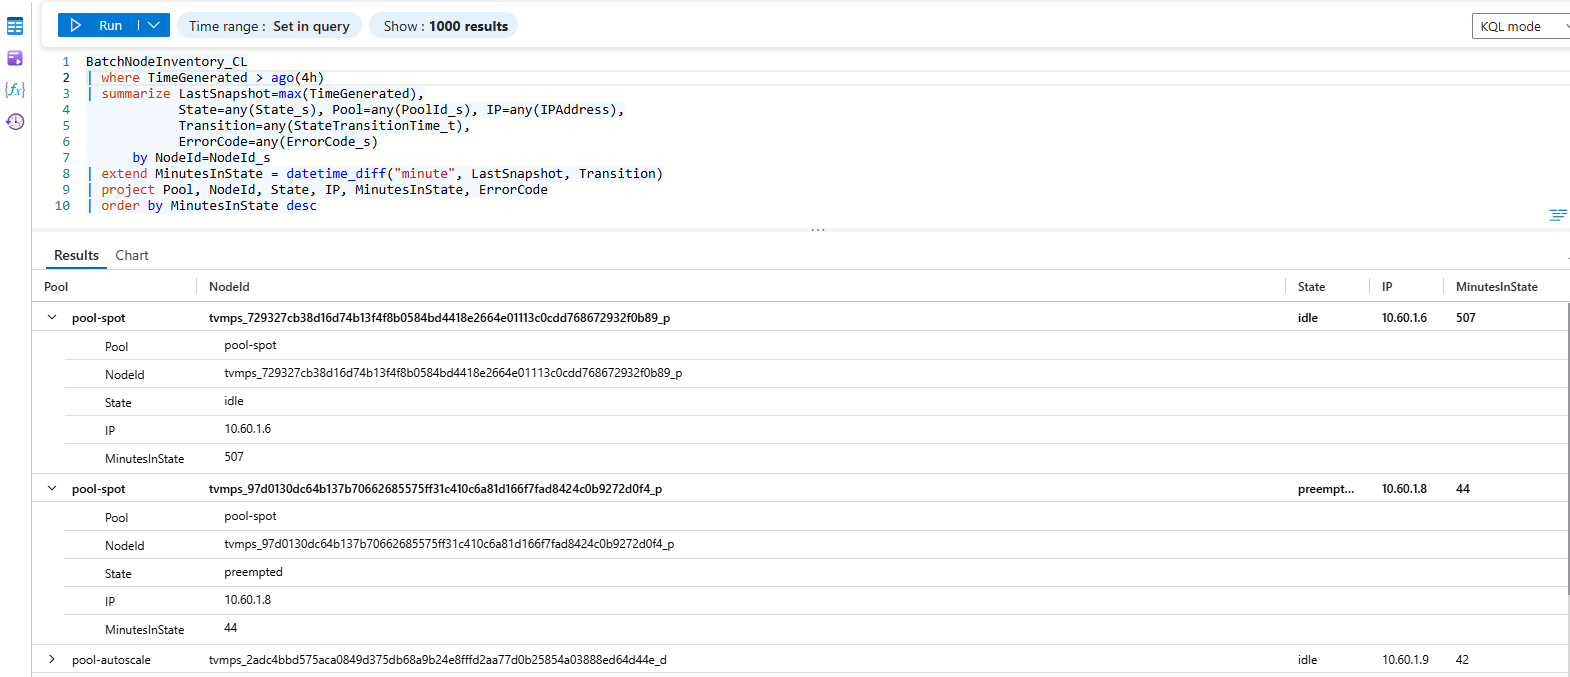
In my repro, I kept the collector running for few minutes before I start to query:
BatchNodeInventory_CL
| where TimeGenerated > ago(1h)
| summarize LastSnapshot=max(TimeGenerated),
            State=any(State_s), Pool=any(PoolId_s), IP=any(IPAddress),
            Transition=any(StateTransitionTime_t),
            ErrCode=any(ErrorCode_s)
      by NodeId=NodeId_s
| extend MinutesInState = datetime_diff("minute", LastSnapshot, Transition)
| project Pool, NodeId, State, IP, MinutesInState, ErrorCode
| order by MinutesInState desc
For the article's 1st scenario, the query becomes:
| where State == "leavingpool" and MinutesInState > 60For the article's 2nd scenario, it becomes:
| where State == "unusable"Both are one-line filters on the same table. You can also filter based on any node state, See: Node state counts
6. The alert
I bet that you won't need a fixed notifications just telling you that the system was checking in (heartbeats). You will need an intelligent alert that would only fire when a specific threshold was crossed.
By leveraging the custom table (BatchNodeInventory_CL) I created, setting up this alert becomes straightforward using a Log Analytics scheduled query rule:
BatchNodeInventory_CL
| where TimeGenerated > ago(10m)
| summarize LastSnapshot=max(TimeGenerated),
            State=any(State_s), Pool=any(PoolId_s), IP=any(IPAddress),
            Transition=any(StateTransitionTime_t),
            ErrCode=any(ErrorCode_s), ErrMsg=any(ErrorMessage_s)
      by NodeId=NodeId_s
| extend MinutesInState = datetime_diff("minute", LastSnapshot, Transition)
| where State in ("unusable","leavingpool","starttaskfailed","offline")
     or MinutesInState > 60
The KQL query for the alert is very similar to the diagnostic query we used earlier, but with a few critical modifications designed for automated monitoring:
-
Shorter Time Window (ago(10m)) as this alert rule will run frequently.
-
We added ErrMsg=any(ErrorMessage_s) to the summarize block. This ensures that when the alert fires, the on-call engineer can read the actual error description without having to dig through logs immediately.
-
The final line instructs Azure Monitor to trigger only if a node enters a distinctly bad state (like unusable, starttaskfailed, or offline) OR a node has been stuck in its current state (such as leavingpool) for more than 60 minutes (MinutesInState > 60)
This rule is typically bound to an Action Group (which handles notifications via email, Microsoft Teams, or PagerDuty). The generated payload directly includes the NodeId, Pool, State, ErrorCode, and MinutesInState. This means the on-call engineer receives the exact identifier of the failing node and the cause of the failure in a single, actionable message.
7. Bonus
Because we have already done the heavy lifting of continuously ingesting detailed, per-node data into the BatchNodeInventory_CL table, that exact same dataset can do double duty.
Without running any additional polling scripts, this single table can act as a live inventory dashboard, providing aggregate counts per pool.
BatchNodeInventory_CL
| where TimeGenerated > ago(30m)
| summarize Nodes=dcount(NodeId_s),
            Idle=dcountif(NodeId_s, State_s=="idle"),
            Running=dcountif(NodeId_s, State_s=="running"),
            Unusable=dcountif(NodeId_s, State_s=="unusable"),
            StartTaskFailed=dcountif(NodeId_s, State_s=="starttaskfailed")
      by Pool=PoolId_s
8. Deploying in Production
To make this solution reliable, the Python script needs to run as a continuous background process.
I would say that you have 3 infrastructure options for deploying this collector script:
- Azure Function (Timer trigger, Python): In my viewpoint, it's ideal because it is serverless, executes on a cron schedule and integrates seamlessly with Managed Identities and Key Vault + it's good cost.
-
Container App Job (Schedule trigger): I would choose this if the collector needs to run within a private Virtual Network (VNet) to reach a secured Batch account, or if you require a custom base image.
-
A small VM with cron/Scheduled Task: I would recommend if you already have a management VM and prefer to utilize the current infra not to provision new Azure resources.
Important Notes:
- An Azure Monitor Log Analytics Function is not viable here, as this solution requires initiating outbound REST API calls outside of the Log Analytics environment.
-
The Log Analytics Shared Key should be stored securely in a Key Vault, or alternatively, the ingestion method should be migrated to Data Collection Endpoints (DCE) / Data Collection Rules (DCR) to eliminate the need for shared keys entirely.
- As mentioned previously, the local az account get-access-token command should be replaced with the Azure SDK's Managed Identity token flow.
-
This solution doesn't replace built-in monitoring. Fleet-wide metrics, task events, and pool events are all still worth ingesting into the same LAW so a single dashboard covers everything. This collector just adds one extra dimension that some of our customers asked for.

 Microsoft