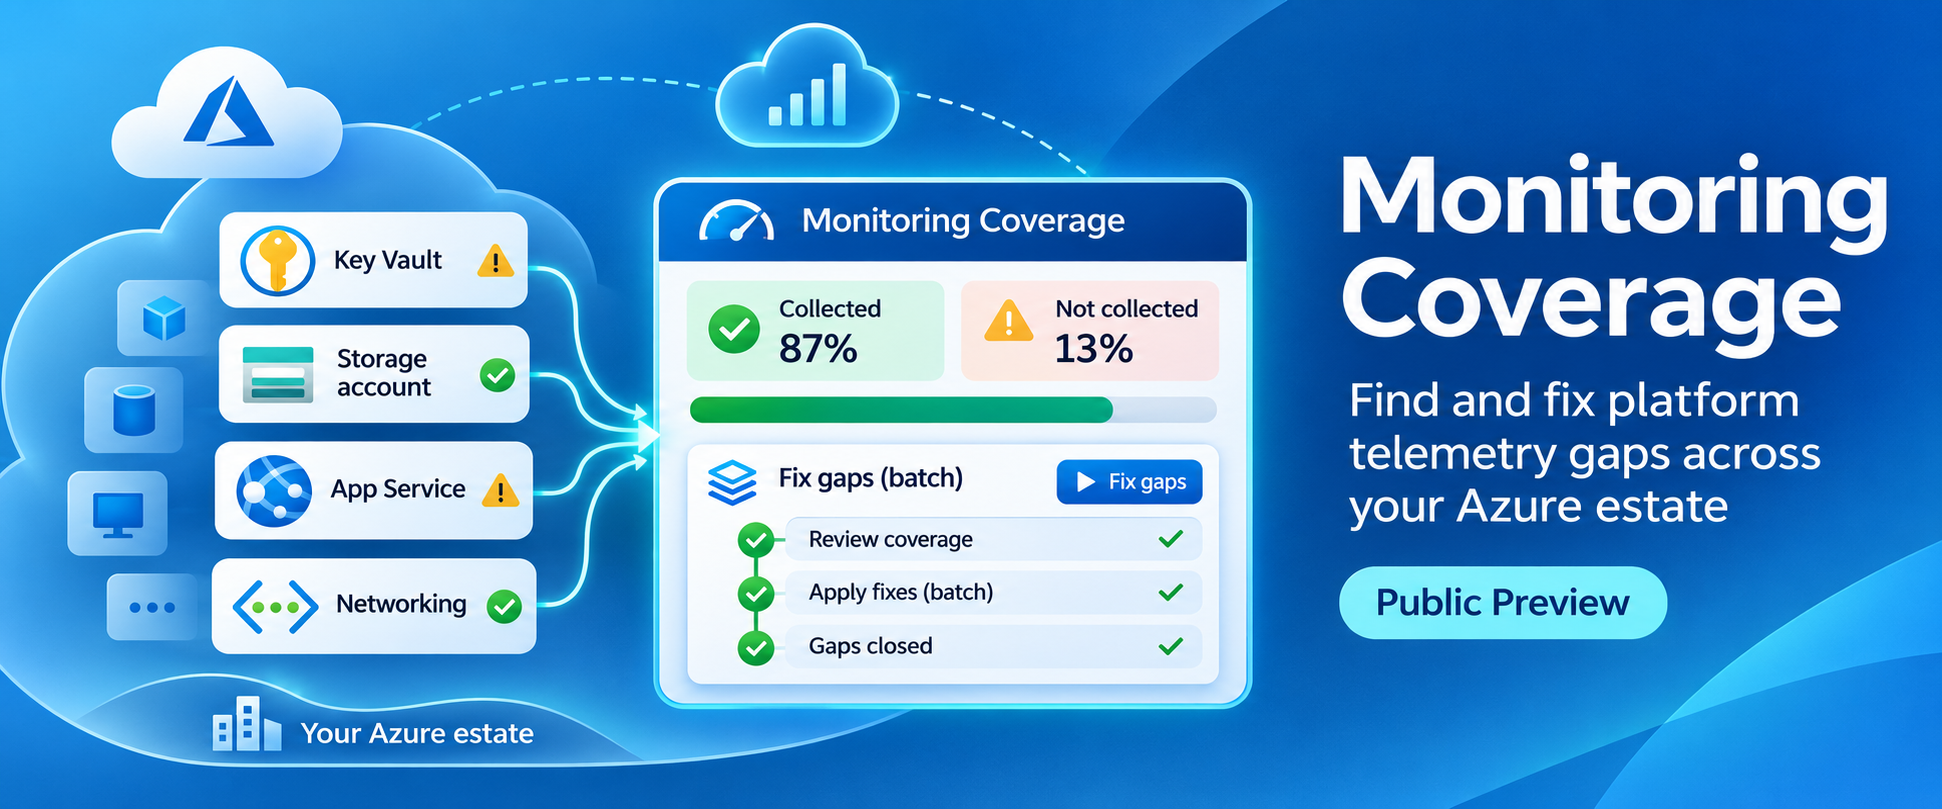
Turning on resource logs and metric export across hundreds of Azure resources used to mean clicking through them one by one or wrangling policy initiatives. Monitoring Coverage in Azure Monitor now shows which resources are collecting platform telemetry, and lets you fix the gaps with a clear plan before anything changes. Now in public preview.
Here's a quick exercise. Pick any key vault in your environment. Is it sending audit logs somewhere you can query them?
Okay, now answer the same question for all of them. And your storage accounts. And your app services.
If your honest answer is “I'd need a day and a spreadsheet,” you're in very good company. That's the exact question we set out to make easy. Monitoring Coverage in Azure Monitor now includes platform telemetry, in public preview. It shows you which of your Azure resources are collecting resource logs and exporting platform metrics, and it lets you close the gaps across many resources at once. In this post, we'll walk through what that looks like and why we built it.
The question that takes way too long to answer
Every Azure resource emits useful platform telemetry. Platform metrics show up automatically, and resource logs record what's happening inside the service: who accessed a secret, which requests failed, what the gateway did at 2 AM. The catch is that resource logs don't go anywhere until you configure a route for them, and exporting metrics beyond the built-in charts takes configuration too.
Historically, that configuration lived resource by resource, mostly in diagnostic settings. Multiply that by a few thousand resources, dozens of resource types, several subscriptions, and a couple of teams, and you end up with an estate where some resources are fully covered, some are half covered, and some were never touched at all.
Usually, nobody notices the gap until it matters. A security investigation needs the audit trail that was never turned on, or a compliance review flags the vaults nobody remembered. That's an expensive moment to discover you were missing data.
What we kept hearing from you
When we talked to customers about platform telemetry, three themes came up over and over.
“I can't see what I'm actually collecting.” Configuration is spread across diagnostic settings, data collection rules, workspaces, storage accounts, and event hubs. Teams told us there wasn't a simple, estate-wide way to answer “which resources are covered?” without building their own queries.
“One resource at a time doesn't scale.” As one enterprise customer in our earlier platform logs preview put it, “managing diagnostic settings across our multi-subscription environment was a constant challenge.” Azure Policy helps with ongoing enforcement, but policy initiatives get complicated quickly when every resource type has different log categories, and reviewing exactly what a remediation will change isn't always easy.
“Do I need a DCR or a diagnostic setting?” Azure Monitor now supports collecting platform logs and exporting metrics with data collection rules (DCRs) for a growing set of resource types, alongside diagnostic settings. That's great for flexibility, but most people just want to say “send my security logs to this workspace” and have the right thing happen.
So we put all three answers in one place.
What's new in Monitoring Coverage
Quick level set on what's new and what isn't:
- Already available: monitoring coverage, introduced at Ignite 2025, helps you find and fix infrastructure monitoring gaps for virtual machines, scale sets, and Kubernetes clusters, including VM insights, container monitoring, recommended alerts, and data flow checks.
- New, in public preview: platform telemetry coverage and at-scale enablement for supported Azure resources such as storage accounts, key vaults, and supported application and networking resources.
Here's how it works, in three steps.
- See where you stand
Open Monitor in the Azure portal and select Monitoring Coverage. Next to infrastructure coverage, there's now a Platform telemetry coverage card that counts your supported resources as Collected or Not collected, with a breakdown by resource type. Filter by subscription, resource group, location, or tags to focus on the part of the estate you own.
Platform telemetry coverage on the monitoring coverage Overview page. Screenshot from Microsoft Learn.
Want the details for one resource? Drill in to see which DCRs and diagnostic settings apply, which signals are enabled, and where the data goes. It's the answer to “what is this thing actually sending?” without opening five different blades.
- Pick what matters to you
Under Monitoring recommendations, select Apply next to Enable Platform Telemetry for supported resources. You can configure up to 100 resources at a time, and you don't have to memorize log categories for each resource type to do it.
Choose Quick setup and pick a focus area: Default, Security, Reliability, Performance / Latency, Cost Optimization, or Test / Dev. Monitoring coverage keeps platform metrics on and selects the log categories that match your goal for every resource type in your selection. Prefer to hand-pick? Switch to manual mode and choose metrics and log categories type by type. Then send the data to a Log Analytics workspace, a storage account, an event hub, or a combination.
Quick setup with focus areas and destinations. Screenshot from Microsoft Learn.
- Check the plan, then enable
Before anything changes, Review + Enable shows you exactly what will happen: which metrics and logs will be collected for each resource type, whether each one will use a DCR, a diagnostic setting, or both, which DCRs and diagnostic settings will be created, and where the data will land.
Review + Enable shows the planned collection mechanism and destinations. Screenshot from Microsoft Learn.
Monitoring coverage figures out the right mechanism for each signal based on what the resource type and region support. You get to keep your intent simple and still see every detail before you commit. And if a few resources fail because of a permission or region issue, the successful ones stay configured, you get resource-level results, and you can retry just the ones that need another try.
Where this fits with Azure Policy
If you already use Azure Policy to enforce diagnostic settings, keep doing that. Policy is the right tool for ongoing enforcement and for automatically configuring resources you haven't created yet.
Monitoring coverage is built for a different moment: you want to see where your gaps are today, choose what to collect with intent, review the plan, and fix things now. Many teams will use both, monitoring coverage to find and close gaps, and policy to keep them closed.
A few things to know during the preview
- Collected means configured. A resource shows as Collected when at least one supported signal has a collection route. That's not the same as every log category being enabled, or as data confirmed in the destination, so it's worth spot-checking the workspace after you enable.
- Batches of 100. Each enablement covers up to 100 resources, and coverage evaluates up to 5,000 resources per view. Filters are your friend for larger estates.
- Existing routes stay put. Enabling doesn't migrate or remove other collection you've already set up, so take a quick look at what's already configured to avoid sending the same data twice.
- Regions and destinations matter. Support varies by resource type, signal, and region. Storage and event hub destinations generally need to be in the same region as the resources, and DCR delivery to them uses a managed identity.
- More data can mean more cost. Ingestion and retention charges can apply depending on your destination, so it's a good idea to review Azure Monitor pricing before you turn on Test / Dev across everything.
Try it and tell us what you think
Head to Monitor > Monitoring Coverage in the Azure portal and take a look at your platform telemetry coverage. You might be surprised, in a good way or otherwise. For prerequisites and a full walkthrough, see Monitoring coverage in Azure Monitor. To go deeper on the building blocks, check out platform logs supported resource types and regions and diagnostic settings in Azure Monitor.
We'd love to hear how it goes. Use the Feedback button at the top of the monitoring coverage page, or share ideas on the Azure Monitor feedback forum. Tell us which resource types you want next, what your focus areas should include, and how big your batches really are. Your feedback will shape where this goes next.
Happy monitoring.

 Microsoft