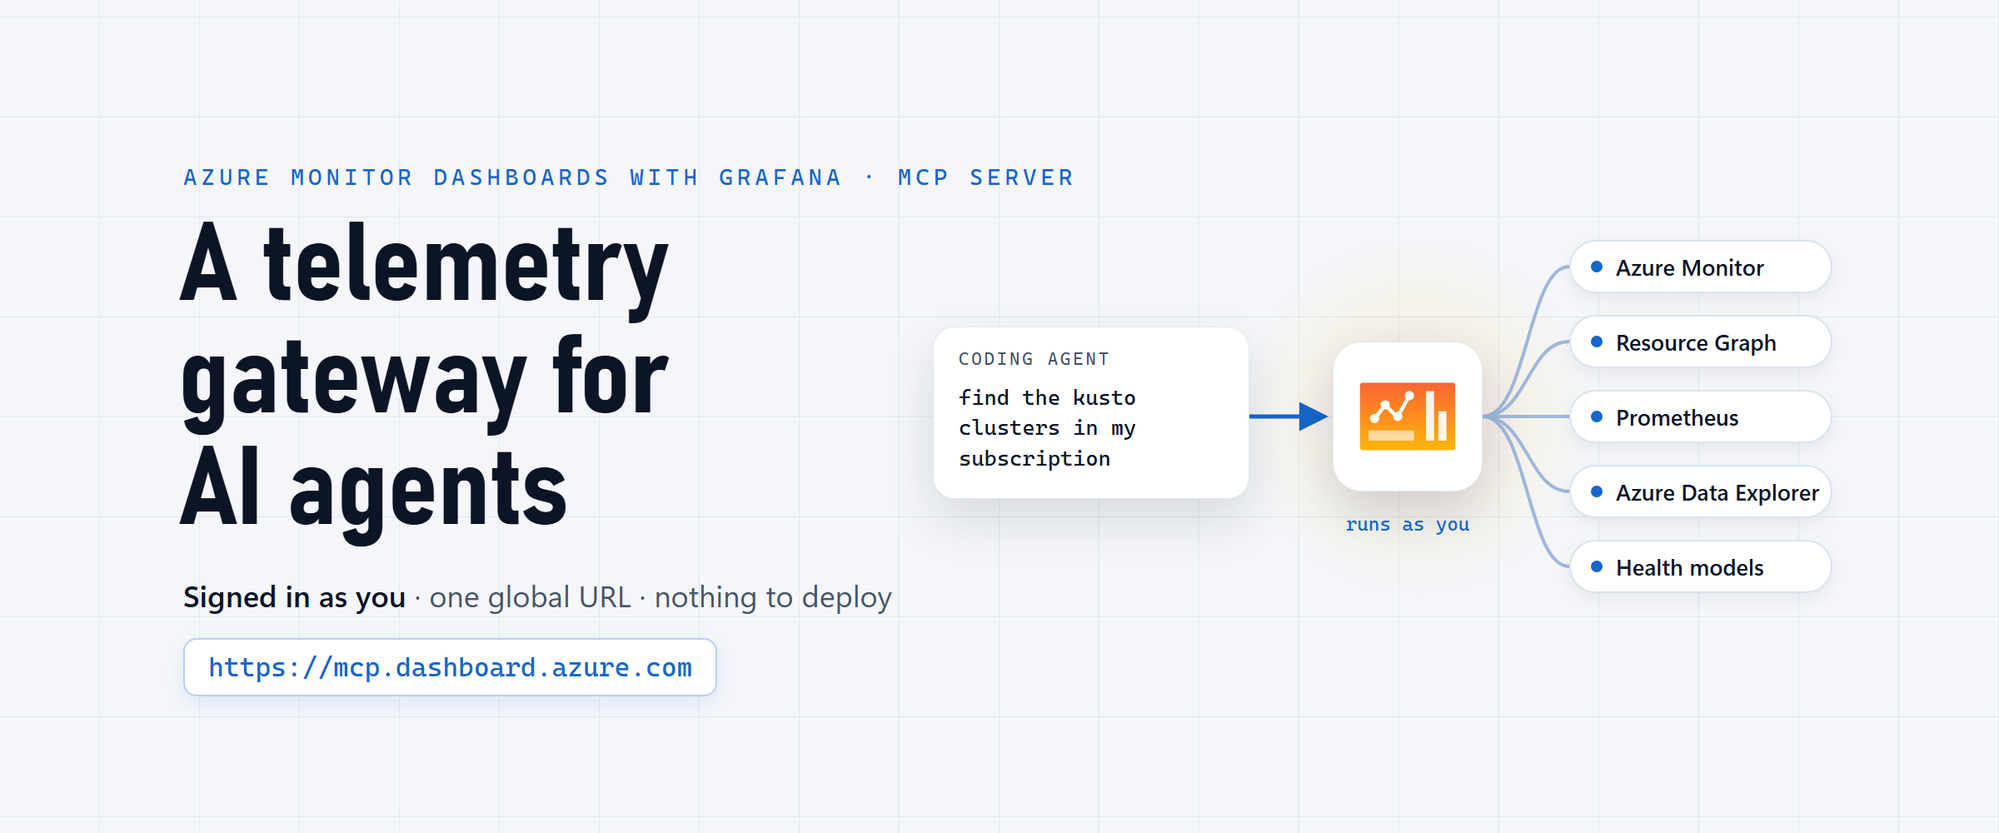
One global endpoint, https://mcp.dashboard.azure.com, connects AI agents to Azure Monitor, Azure Resource Graph, Prometheus, Azure Data Explorer and health models, with no Grafana resource to create.
We're introducing the Azure Monitor dashboards with Grafana remote MCP server, a global Model Context Protocol (MCP) endpoint at https://mcp.dashboard.azure.com. It lets AI agents such as GitHub Copilot query Azure Monitor metrics and logs, Azure Resource Graph, Prometheus in Azure Monitor workspaces, Azure Data Explorer and Azure Monitor health models, and find, read and update your dashboards. It needs no Azure Managed Grafana resource, no MCP server to deploy and no Grafana data source. Each tool call runs as the signed-in Microsoft Entra ID user, so what your agent can reach follows your own Azure access.
Set it up in one click
Install in Visual Studio Code: https://aka.ms/join-dashboard-mcp
The link opens Visual Studio Code and adds the server, https://mcp.dashboard.azure.com, to its MCP configuration. Confirm the installation, start the server, and sign in with your Microsoft Entra ID account when prompted, in the tenant that holds your Azure resources. Then open GitHub Copilot Chat in Agent mode and turn on the server's tools.
The link holds only the server's name and URL, no credentials, and it doesn't create any Azure resource. For GitHub Copilot CLI and other MCP clients, see "Connect" below.
One prompt, one Kusto cluster
I copied the StormEvents sample from the public Azure Data Explorer help cluster (59,066 US storm events from 2007, plus the state population table that comes with it) into a new cluster in one of my dev subscriptions. Then I opened GitHub Copilot Chat in Visual Studio Code, in Agent mode, with one MCP server connected, and typed one prompt:
use Azure Resource Graph to find the kusto clusters in my subscription
<subscription-name>, see what data is in the running one, then tell me which states had the most storm damage per person and what drove the top one
I didn't give it the cluster's URL, the database name, a table or a column, and I had never added the cluster to a Grafana instance. Copilot reported "Completed 20 steps in 1m 25s" and came back with this:
North Dakota comes first, at $447.05 per person. California had by far the most damage in total, $2.8 billion, and is seventh. Copilot also raised a caveat I hadn't asked for: the population table has no year field, so the per-person figures aren't a verified 2007 comparison. Then it explained the top of the list, partly from the events' own narratives:
That one MCP server is the new Azure Monitor dashboards with Grafana remote MCP server. Connecting it took a one-click install link and a sign-in. I hadn't created a Grafana instance or configured a data source.
What it is
The endpoint is the same for everyone:
https://mcp.dashboard.azure.com
For most MCP clients, that URL is the whole configuration: it names no Grafana instance, subscription or resource group. You sign in with your Microsoft Entra ID account, and each call runs in the tenant you signed in to. Your Azure role assignments decide which subscriptions, resources and data a call can see. Signing in to the MCP server doesn't grant any access of its own.
It has 21 tools in five groups:
| Group | Tools | What they reach |
|---|---|---|
| Azure monitoring | 10 | Log Analytics and Application Insights logs (KQL), Azure Monitor metrics and their definitions, distributed traces, Azure Resource Graph, subscriptions, the activity log, Resource Health and service health events |
| Dashboards | 3 | Your saved Azure Monitor dashboards and the built-in ones: search, inspect, update |
| Prometheus | 4 | Azure Monitor workspaces: discover them, list metric and label names, run PromQL |
| Azure Data Explorer | 2 | Azure Data Explorer clusters your account can query: list clusters, databases and schemas, run KQL |
| Health models | 2 | Azure Monitor health models: the entity graph and its states, now or at a past time, and their history |
Twenty of the 21 only read. The one that writes, amgmcp_dashboard_update, changes a saved dashboard you already have write access to. It can validate a change without saving it, and when the agent passes the version it read, the tool refuses to save over an edit made since then.
What the agent did
Of the 20 steps, 12 were calls to the server, all to azmon-mcp, the name the one-click link gives it:
| Calls | Tool | What they did |
|---|---|---|
| 2 | amgmcp_query_resource_graph | Looked up the subscription's ID by its name, then listed the Kusto clusters in it |
| 2 | amgmcp_kusto_get_metadata | Listed the cluster's databases, then read the schema of Samples |
| 8 | amgmcp_kusto_query | Profiled both tables, checked the join and duplicate events, ranked the states, then broke North Dakota down by event type, by episode and by its costliest events |
The second Resource Graph query found the cluster:
resources
| where subscriptionId == '<subscription-id>'
| where type =~ 'microsoft.kusto/clusters'
| project name, resourceGroup, location, state = tostring(properties.state),
    provisioningState = tostring(properties.provisioningState),
    uri = tostring(properties.uri), sku, id
| order by name asc
{
"name": "mcpdemo2611",
"location": "westus2",
"state": "Running",
"uri": "https://mcpdemo2611.westus2.kusto.windows.net",
"sku": { "name": "Dev(No SLA)_Standard_E2a_v4", "tier": "Basic", "capacity": 1 }
}Two fields matter here. uri is the clusterUrl that both Kusto tools take, so Resource Graph hands the agent the next call's argument. state tells it whether the cluster can answer at all, which is what "the running one" in my prompt asked for.
The first amgmcp_kusto_get_metadata call, with just that URL, listed one database, Samples. The second, with the database name, returned its schema: StormEvents with 22 columns (StartTime, State, EventType, DamageProperty, DamageCrops and so on) and PopulationData with two, State and Population. The tool description tells the agent to copy names exactly as returned, because Kusto names are case-sensitive.
Before ranking anything, Copilot checked the data: row counts, date range and missing values, whether every state finds a population, and whether any event is counted twice. It sent those queries two or three at a time, and each came back in about a second or less. This is the ranking:
StormEvents
| summarize Events = count(), PropertyDamage = sum(tolong(DamageProperty)),
    CropDamage = sum(tolong(DamageCrops)) by State
| join kind=inner (PopulationData) on State
| where State !in ('DISTRICT OF COLUMBIA', 'PUERTO RICO')
| extend TotalDamage = PropertyDamage + CropDamage
| extend DamagePerPerson = todouble(TotalDamage) / todouble(Population)
| project State, Events, Population, PropertyDamage, CropDamage, TotalDamage, DamagePerPerson
| top 10 by DamagePerPerson desc
Nothing in my prompt says "join" or "leave out DC and Puerto Rico". The schema has a State column in both tables, "per person" needs the second one, and "states" rules out the two rows that aren't. The result comes back as a data frame with metadata alongside it:
{
  "executedQuery": "StormEvents | summarize … | top 10 by DamagePerPerson desc\n| take 11",
  "rowCount": 10,
  "totalRowCount": 10,
  "truncated": false,
  "durationMs": 37
}
The agent asked for at most 10 rows, so the tool appended | take 11: one row past the cap is how it proves whether the result was cut off, and it reports that as truncated. The agent knows whether it has seen everything before it summarizes.
One of the 20 steps wasn't an MCP call. The query for the eight costliest events in North Dakota returned their full narratives, 21.4 KB of text, more than Copilot reads in one go. It saved the result to a temporary file and asked to run a PowerShell command to parse it, and I allowed it.
Every one of those calls ran as me, with my own Microsoft Entra ID token, and none of them needed a data source that I had configured. The second half of that sentence is the real change.
No data source, no default cluster
On the per-instance Azure Managed Grafana MCP endpoint, an agent reaches a Kusto cluster through a Grafana data source: someone adds the cluster to the instance, chooses the credentials it connects with, and from then on queries go through that data source. That is the right shape for a team that shares one instance. It is the wrong shape for "I have a cluster and a question."
The global endpoint has no data sources to configure. Each Kusto call names its cluster in clusterUrl and runs with your token, so the cluster checks your own database permissions, as it would in the Azure Data Explorer web UI. A database you can't query there, the agent can't query here either.
That also means there is no default cluster, so discovery has to come from somewhere. It comes from Azure. Resource Graph lists the clusters in your subscriptions, with their state and URI, and amgmcp_kusto_get_metadata called with no arguments lists the clusters you can read in Azure. A cluster you can query but that isn't in any of your subscriptions, such as the public https://help.kusto.windows.net, works too: pass its URL.
The same pattern runs through the other groups. The Azure Monitor tools take a resource ID or a subscription, not a data source. Each Azure Monitor workspace is its own Prometheus source, found with amgmcp_prometheus_list_workspaces. Health models are found with Resource Graph and read with their own two tools.
The global endpoint or an instance endpoint?
The global endpoint doesn't replace the MCP endpoint built into each Azure Managed Grafana instance. They answer different questions.
| Azure Monitor dashboards with Grafana MCP | Azure Managed Grafana MCP | |
|---|---|---|
| Endpoint | https://mcp.dashboard.azure.com | https://<grafana-endpoint>/api/azure-mcp |
| What you create first | Nothing | An Azure Managed Grafana instance |
| Sign-in | Microsoft Entra ID user only | Microsoft Entra ID user, service principal or managed identity, or a Grafana service account token |
| Whose access a query uses | The signed-in user's | The identity each Grafana data source is configured with |
| Data | Azure Monitor, Resource Graph, Prometheus in Azure Monitor workspaces, Azure Data Explorer clusters you can query, health models | The instance's data sources: Azure Monitor, Prometheus, Azure Data Explorer, Loki, SQL databases and ClickHouse |
| Dashboards | Find and read saved and built-in Azure Monitor dashboards; update saved ones | Find, read, create and update the instance's dashboards |
| Alerts | Not included | Grafana-managed alert rules |
| A good fit for | You, in your editor or terminal | Agents that run as a service, such as Microsoft Foundry agents and Azure SRE Agent |
If you already run an Azure Managed Grafana instance with data sources your team curates, keep pointing your service agents at its endpoint. If you want your own agent to look at your own Azure resources right now, start with the global one.
Connect
Visual Studio Code with GitHub Copilot. Use the one-click install link at the top of this post, https://aka.ms/join-dashboard-mcp, or add the server by hand in .vscode/mcp.json:
{
  "servers": {
    "azure-monitor-dashboard-mcp": {
      "type": "http",
      "url": "https://mcp.dashboard.azure.com"
    }
  }
}
GitHub Copilot CLI. Start copilot, enter /mcp add, and fill in the form: server type HTTP, URL https://mcp.dashboard.azure.com, tools *. Press Ctrl+S to save and sign in when prompted. GitHub Copilot CLI keeps its own MCP configuration, so it doesn't read .vscode/mcp.json.
Other MCP clients that support the MCP authorization flow can sign in through OAuth: the server publishes its sign-in configuration at https://mcp.dashboard.azure.com/.well-known/oauth-protected-resource. For a client that only takes an Authorization header, the docs show how to get a user access token with the Azure CLI. Treat that token as a secret, and expect to replace it when it expires.
What it doesn't do
- It accepts user sign-in only. Service principals, managed identities and Grafana service account tokens aren't supported. An agent that runs unattended, as a service, belongs on an Azure Managed Grafana instance's endpoint.
- It can't create dashboards or change built-in ones. Create a dashboard in the Azure portal; after that, the agent can read it and update it.
- It has no Grafana alerting, Loki, SQL or ClickHouse tools. Those live on the per-instance endpoint, which reaches whatever data sources the instance has.
Try it
Connect with https://aka.ms/join-dashboard-mcp or /mcp add, and try a few of these, with your own IDs:
List the Azure subscriptions I can access.
Use Azure Resource Graph to find the Kusto clusters in subscription
<subscription-id>, then show me what data is in the running one.
Show management-plane changes in subscription
<subscription-id>over the last day.
Find saved and built-in Kubernetes dashboards, then inspect the panels and queries of dashboard
<dashboard-uid>.
Find Azure Monitor health models in subscription
<subscription-id>and explain which signals are making<health-model>unhealthy.
The full tool list, the example prompts and the setup steps are in Connect to the Azure Monitor dashboards with Grafana remote MCP server.

 Microsoft