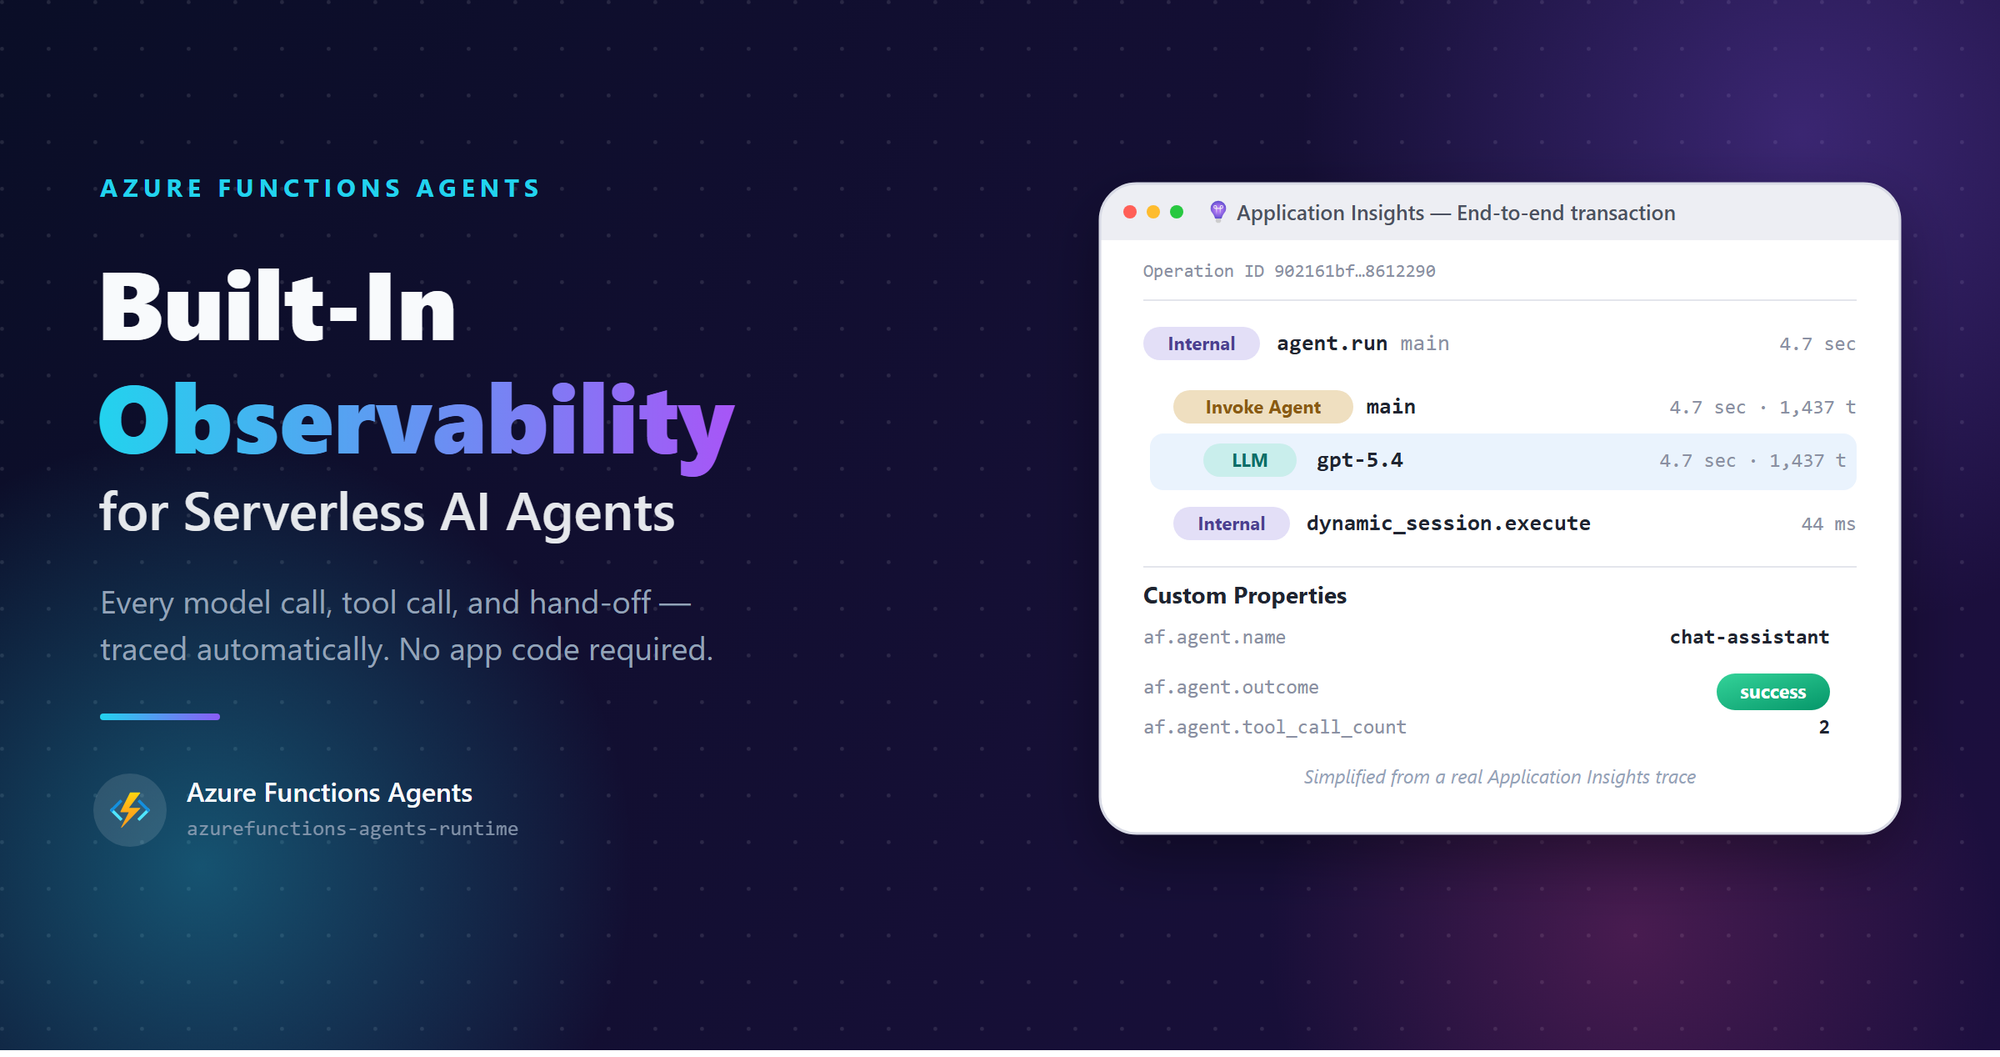
Every model call, tool invocation, and hand-off - traced automatically, with zero app code.
Azure Functions Agents - the markdown-first runtime that turns a folder of *.agent.md files into a serverless Azure Functions app - now ships with OpenTelemetry tracing built into the runtime itself. Every agent run becomes a real, structured trace in Application Insights: the model used, the session, and every tool call or sub-agent hand-off along the way. None of it requires writing a line of telemetry code in your app.
Click here to create and run a Serverless Agent using Azure Functions
Full visibility, zero code
Bootstrapping an agent app is still two lines:
from azure_functions_agents import create_function_app app = create_function_app()Turning on export is two settings, no code:
In requirements.txt -
pip install azurefunctions-agents-runtime[monitor]APPLICATIONINSIGHTS_CONNECTION_STRING=<your-app-insights-connection-string></your-app-insights-connection-string>From there, every run shows up automatically in Application Insights' Agents view, tagged with a consistent set of attributes the runtime adds for you: which agent ran, which model answered, which tools it called, and how the run finished. You don't pick and choose what to instrument - you get the whole run, every time, the same way, regardless of what the agent is doing underneath.
That consistency is what makes the tracing useful for more than debugging. It's also the simplest way to see something that would otherwise happen invisibly inside a single API call.
Example: watching a model decision happen in real time
One good illustration is Model Router - a model you deploy yourself in your Foundry resource, like any other model deployment. Point an agent's model setting at that deployment, and Model Router picks a different underlying LLM per prompt: a smaller model for simple requests, a larger one once a prompt actually needs it.
Normally that choice is invisible - it happens inside one API call. But because Azure Functions Agents traces every run the same way no matter which model is behind it, the decision shows up for free. Same chat session, two prompts:
|
Prompt |
Model Router picked |
Why |
|
Easy, one-shot question |
gpt-5-mini |
Small model is comparable quality for a fraction of the cost. |
|
Complex, multi-step reasoning |
gpt-5.4 |
Router escalates to a larger model once the prompt needs it. |
Both requests show gen_ai.request.model = model-router, that's the deployment the agent called. What changes per message is the response attribute, which names whichever model Router actually picked.
Trace for the easy prompt (response model gpt-5-mini)
Full session in the Agents pane of Application Insights
Nothing here was instrumented specifically for Model Router - this is just what a trace looks like now, for any agent, on any model.
Try it yourself
- Add the two settings above to an existing agent app - no code changes needed.
- Send a request or two, then open Application Insights' Agents view (or Transaction Search).
- Look at what's already there: model, session, tool calls, and timing, all correlated under one trace.
Wrapping up
The point isn't any single scenario - it's that whatever you build next on Azure Functions Agents, from a simple single-model agent to something as dynamic as router-based model selection, you'll be able to see exactly what happened without adding anything yourself. Try it against your own agent and see what's already there.
Resources

 Microsoft