Introduction
Modern data platforms are no longer just about moving and transforming data. In production, what really matters is reliability and how quickly you can understand and react when something breaks.
If you’re using Azure Synapse/ADF/Microsoft Fabric, you already have built-in monitoring. You can see pipeline runs, error messages.
But it doesnt show you activity level errors, Pipeline errors works well when you’re debugging a single failure.
But it doesn’t scale.
Once you have dozens of pipelines running across multiple environments, failures become harder to track. You find yourself jumping between pipeline runs, scanning activity outputs, and trying to piece together what actually happened.
And suddenly, simple questions become difficult to answer:
- Which datasets are failing most often?
- Are failures concentrated in Bronze, Silver, or Gold?
- Is this a one-off issue or a recurring pattern?
- What changed between yesterday and today?
At that point, pipeline-level monitoring is no longer enough. You need something more structured.
P.S the framework can be implemented across both Synapse and Microsoft Fabric environments with minimal changes.
Why we need a custom logging framework
The core issue is that pipeline failures are treated as runtime events, not as data.
They live inside pipeline output and are tied to a specific run. This makes them hard to query across time, aggregate across pipelines, correlate across environments, or understand which activities failed inside the pipeline or integrate into alerting and dashboards in a consistent way.
Pipeline Failures are visible but activity failures are not , and they’re not operationalized, what’s missing is a central place where all failures are captured in a consistent, structured format, regardless of which pipeline or dataset produced them including Activity level logs.
That’s where a custom logging framework comes in, instead of relying only on built-in monitoring, we introduce a layer that captures failures as structured events, standardizes the payload across pipelines, and sends it to Log Analytics where it can be queried using KQL.
This shifts the model from checking a pipeline when it fails to treating failures as a dataset that can be analyzed, monitored, and improved over time.
Once you make that shift, you can build alerts based on patterns instead of reacting to single failures, track reliability across datasets or domains, and identify recurring issues instead of dealing with incidents one by one.
It also changes who can use the data, visibility is no longer limited to engineers digging into pipeline runs it becomes accessible at the platform level for leads and stakeholders.
This framework doesn’t replace Synapse monitoring. It complements it by adding a proper observability layer on top.
Architecture
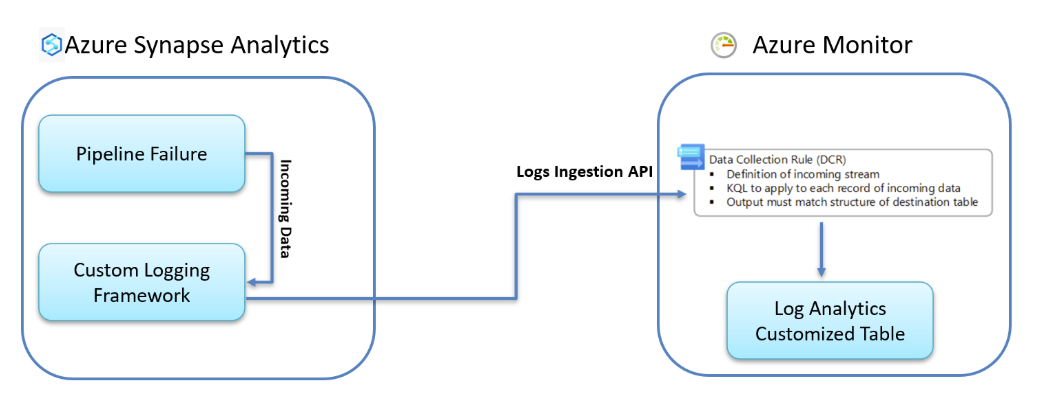
When a pipeline fails in Synapse, the failure is intercepted through a dedicated failure path. At this stage, we don’t just log the error as-is we pass it through a custom logging framework that transforms the failure into a structured payload.
This payload includes key context such as pipeline name, activity, environment, dataset, layer (Bronze/Silver/Gold), error details, and correlation identifiers.
The important part here is consistency every pipeline emits the same schema, regardless of its logic.
Once the payload is constructed, it is sent to Azure Monitor using the Logs Ingestion API, this API acts as the entry point into the monitoring system and decouples the pipelines from the underlying storage implementation.
A Data Collection Rule (DCR) sits behind the ingestion layer and defines how incoming data is handled. It acts as a contract for the payload schema and optionally applies transformations before the data is persisted.
Finally, the logs are stored in a custom Log Analytics table, where they become fully query-able using KQL, at this point, failures are no longer tied to a single pipeline run they are part of a centralized dataset that can be analyzed across time, environments, and domains.
Setting up Log Analytics
Before integrating the logging framework with Synapse, we first need to set up the destination for our logs, this includes creating a Log Analytics workspace, defining a custom table, and configuring the ingestion path using a Data Collection Rule (DCR).
The goal is to create a pipeline where structured failure events can be received, validated, and stored in a consistent format.
P.S all steps mentioned in this blog can be automated with ARM templates.
1. Create a Log Analytics workspace
Start by creating a Log Analytics workspace. This will act as the central store for all failure logs across your data platform.
In the Azure Portal:
- Navigate to Azure Monitor → Log Analytics workspaces
- Create a new workspace in your target subscription and region
- Choose a meaningful name (for example: log-analytics-data-domain)
This workspace becomes the single place where all pipeline failures will be collected and queried.
2. Create a custom table for pipeline failures
Instead of relying on generic tables, we define a dedicated custom table to store pipeline failure events.
From the Log Analytics workspace:
- Go to Tables → Create → Custom table (DCR-based)
- Define a table name such as:
DataDomain_SynapsePipelineErrors_CL [it has to end with CL suffix]
At this stage, you’ll define the schema that represents your logging payload. Typical fields include:
- TimeGenerated
- PipelineName
- PipelineRunId
- ActivityName
- ActivityType
- Status
- ErrorCode
- ErrorMessage
- Severity
- Environment
- Layer
- DatasetName
- PartitionDate
- WorkspaceName
- CorrelationId
The key here is consistency, this schema will be reused across all pipelines, so take the time to define it properly.
3. Create a Data Collection Rule (DCR)
The Data Collection Rule defines how incoming data is ingested into Log Analytics. It acts as both a schema contract and a routing mechanism.
In Azure Portal:
- Go to Azure Monitor → Data Collection Rules
- Create a new DCR and associate it with your Log Analytics workspace
Within the DCR:
- Define a custom stream (for example: DataDomain_SynapsePipelineErrors_CL)
- Map this stream to your custom table
- Optionally define transformations using KQL (for example, renaming fields or enforcing types)
This step is critical because it decouples your pipelines from the storage layer. If the schema evolves later, you can adjust it here without changing pipeline logic.
4. Configure the Logs Ingestion endpoint
Once the DCR is created, Azure generates an ingestion endpoint that will be used by your pipelines.
The endpoint follows this pattern:
https://<dce>.<region>.ingest.monitor.azure.com/dataCollectionRules/<dcrId>/streams/<streamName>?api-version=2023-01-01This endpoint is what your Synapse pipeline will call using a Web Activity.
At this point, you should also:
- Enable Managed Identity authentication
- Grant the Synapse workspace permission to send data to the DCR
This ensures secure ingestion without using secrets.
5.RBAC for Managed Identity
The Managed Identity used by Synapse or Microsoft Fabric must have the following Azure RBAC role:
Monitoring Metrics Publisher
This role allows the identity to send data through the Azure Monitor Logs Ingestion API.
The role should be assigned on the:
Data Collection Rule (DCR) resource
In Azure Portal:
Data Collection Rule (DCR) → Access Control (IAM) → Add Role Assignment → Monitoring Metrics Publisher → Select Synapse/Fabric Managed Identity
Without this role assignment, requests to the Logs Ingestion API will fail with authorization errors such as HTTP 403.
6. Validate the setup
Before integrating with pipelines, it’s a good idea to validate that ingestion works.
You can send a test payload (via Postman or a simple script) and then query your table in Log Analytics:
DataDomain_SynapsePipelineErrors_CL | take 10If everything is configured correctly, you should see your test records appear.
Integrating with Synapse pipelines
Now that the ingestion layer is ready, the next step is connecting Synapse pipelines, so failures are logged automatically instead of sending manual test payloads.
The idea is simple:
whenever a pipeline activity fails, we capture the failure details, transform them into a structured payload, and send them directly to the Logs Ingestion API, this turns pipeline failures into centralized operational events.
1. Add a failure handling path
Inside your Synapse pipeline, add an On Failure dependency from the activities you want to monitor.
Typically, this includes critical activities such as:
- Copy Activities
- Notebook executions
- Stored Procedures
- Data Flows
- Web Activities
Instead of allowing the pipeline to fail silently, the failure path redirects execution into a dedicated logging step , in most production environments, this is implemented as a reusable child pipeline such as:
pipeline name : Customized Logs API
This keeps logging logic centralized and avoids duplicating the same implementation across dozens of pipelines.
2. Pass failure metadata as parameters
The logging pipeline should receive operational context from the parent pipeline.
Typical parameters include:
- Pipeline name
- Pipeline run ID
- Activity name
- Activity type
- Error code
- Error message
- Environment
- Layer (Bronze/Silver/Gold)
- Dataset name
- Severity
- Correlation ID
This metadata becomes the foundation of the structured logging payload.
The more operational context you capture here, the easier troubleshooting becomes later.
3. Construct the logging payload
Inside the logging pipeline [Customized Logs API], use a dynamic content expression to construct a JSON payload matching the Log Analytics schema.
Example payload:
concat( '[{"TimeGenerated":"', utcNow(), '","PipelineName":"POC_Test"', ',"PipelineRunId":"', pipeline().RunId, '","PipelineStatus":"Failed"', ',"ActivityName":"TestActivity"', ',"ActivityType":"Web"', ',"ActivityStatus":"Failed"', ',"ErrorCode":"TEST"', ',"ErrorMessage":"POC test"', ',"Severity":"Warning"', ',"Environment":"Test"', ',"Layer":"Bronze"', ',"ExecutionStage":"POC"', ',"DatasetName":"TestDataset"', ',"PartitionDate":"', utcNow(), '","WorkspaceName":"', pipeline().DataFactory, '","TriggerName":"Manual"', ',"TriggerTimeUtc":"', utcNow(), '","DurationMs":1000', ',"RetryCount":0', ',"Compute":"Synapse"', ',"CorrelationId":"', pipeline().RunId, '","Payload":{"source":"test","target":"loganalytics"}}]' )The important part is schema consistency.
Every pipeline should emit the same payload structure regardless of which activity failed.
This makes downstream querying and dashboarding significantly easier.
4. Send logs using a Web Activity
After constructing the payload, use a Web Activity to send the data to the Logs Ingestion API endpoint configured earlier.
Typical configuration:
URL:
https://<data-collection-endpoint>.<region>.ingest.monitor.azure.com/dataCollectionRules/<dcr-id>/streams/<stream-name>?api-version=2023-01-01
Method
POST
Authentication
Managed Identity
Resource
https://monitor.azure.com
Headers
{ "Content-Type": "application/json" }
Body
Dynamic JSON payload generated in the previous step.
I highly recommend using Managed Identity avoids storing secrets or credentials inside Synapse pipelines and keeps authentication fully managed by Azure.
5. Validate end-to-end ingestion
Once the pipeline is connected, trigger a controlled failure and verify that the event appears in Log Analytics.
Run:
DataDomain_SynapsePipelineErrors_CL | sort by TimeGenerated desc | take 20
You should now see real pipeline failures arriving automatically from Synapse.
At this point, the framework becomes fully operational.
Failures are no longer isolated runtime events buried inside activity outputs they are centralized, queryable operational records that can be analyzed across the entire platform.
Future Steps
Now that we have a centralized logging framework in place, we can take observability one step further by building operational dashboards in Power BI or Microsoft Fabric to analyze reliability trends across the entire data platform. Instead of reacting to isolated pipeline failures, we can aggregate logs across pipelines, datasets, environments, and medallion layers to identify what is actually causing instability over time. This allows engineering teams to detect recurring error patterns, identify unstable datasets, measure platform reliability, analyze failure spikes after deployments, and understand where operational bottlenecks are concentrated. By transforming pipeline failures into structured operational telemetry, the framework evolves beyond simple logging into a true observability platform that supports proactive reliability engineering, helping teams move from reactive firefighting to data-driven operational improvements based on measurable reliability KPIs such as failure trends, MTTR, SLA compliance, severity distribution, and pipeline health scoring.
Links

 Microsoft