- Home
- Azure
- Azure Observability Blog
- Explore the new capabilities with Datadog—An Azure Native ISV Service
- Subscribe to RSS Feed
- Mark as New
- Mark as Read
- Bookmark
- Subscribe
- Printer Friendly Page
- Report Inappropriate Content
Datadog – An Azure Native ISV Service seamlessly integrates with Azure, allowing automatic sending of logs and metrics to your Datadog organization for monitoring your Azure workloads. The service can be easily managed through clients such as Azure Portal, Command-Line Interface (CLI), and software development kits (SDKs), without requiring any custom code or connectors. The service, co-developed by Microsoft and Datadog, has continued to grow with deeper integrations based on your feedback.
Here are some of the top features shipped recently that we would like to highlight:
- Multi-Subscription Monitoring – Easily manage monitoring of all your Azure subscriptions with Datadog from one place for a single pane-of-glass view.
- Quickstart Template to provision a new Datadog org - a new template in the Code Samples gallery that deploys a new Datadog – An Azure Native ISV Service resource and creates a new organization in Datadog’s US3 site to monitor resources in your Azure subscription.
- Collect Custom Metrics – enable collection of custom metrics from Azure Application Insights through your Datadog resource.
Monitoring your Azure subscriptions with Datadog is now a breeze
We are excited to announce the general availability of a scalable multi-subscription monitoring feature with Datadog – An Azure Native ISV Service, that takes your experience of monitoring your Azure workloads to the next level. This feature has been designed to bring ease and efficiency to your monitoring tasks. With just one Datadog – An Azure Native ISV Service resource, you can now configure and manage monitoring across all your Azure subscriptions in a single place. Say goodbye to the hassle of setting up individual monitoring resources for each subscription!
To dive into this seamless monitoring journey, click on the Datadog resource to begin. If you haven’t created a Datadog resource yet, learn how to get started with Datadog’s Azure native integration.
Navigate to the Monitored Subscriptions section within the Datadog organization configurations section.
By default, the subscription where your Datadog resource resides will be monitored. To include more subscriptions, click on the “Add subscriptions” button. Choose the subscriptions you want to monitor using the same resource.
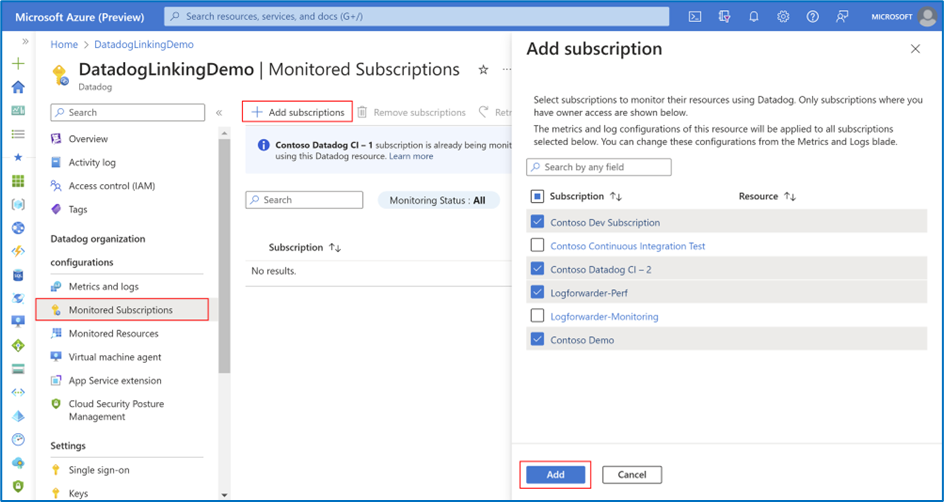
Note: Only the subscriptions you have the Owner role assigned to will be displayed to you.
Click on Add. You should now see the list of subscriptions you chose in the monitored subscriptions list. You can check the Monitoring Status of the subscriptions you added. If they are added successfully, the status would be “Active” else, it would be “Failed”.
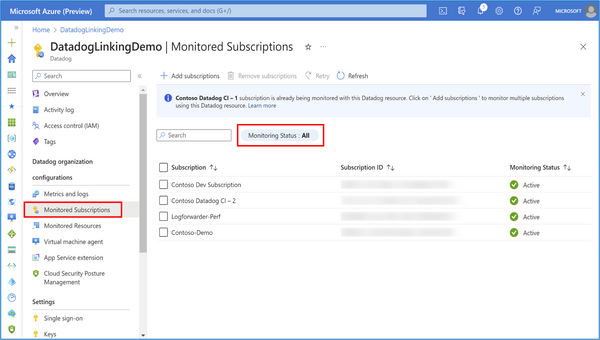
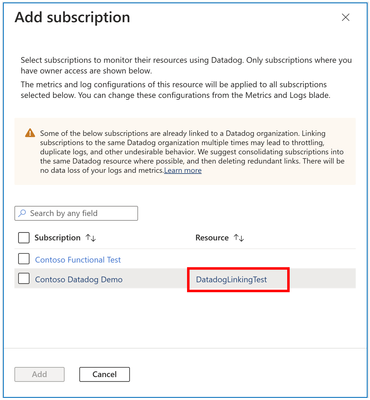
For optimal organization and streamlined data flow, we recommend consolidating redundant Datadog resources linked to the same organization. This not only avoids duplicate data but also prevents issues like throttling. In the example shown below, a resource named ‘DatadogLinkingTest’ is linked to the same organization in Contoso Datadog Demo subscription. Before adding this subscription, it is advised to delete this existing resource.
Tag rules for metrics and logs defined for your Datadog resource apply across all the subscriptions you're monitoring, so you do not have to configure every single subscription separately. But, if you ever want to reconfigure these tag rules, you can edit the inclusion/exclusion tag rules from the Metrics and Logs blade of the Datadog resource. Tag rules, if changed, would be applied to all subscriptions added through the Monitored Subscriptions blade.
With these steps, you're all set! Head to the “Monitored Resources” section in your Datadog resource, and effortlessly filter by subscription(s) to monitor logs and metrics status for the resources within the selected subscription(s).

Likewise, agent management experience for App Services and virtual machines (VMs) also spans multiple subscriptions now.

If you decide to halt monitoring for resources within a subscription through the Datadog resource, you can remove that subscription from the Monitored subscriptions list. In the Monitored Subscriptions blade, choose the subscription you want to stop monitoring, and click on the “Remove subscriptions” button.
Note: the default subscription (the one where your Datadog resource originated) cannot be removed.
Though this approach vastly simplifies the way you set up monitoring for your subscriptions, there are a couple of scenarios that may still require you to create multiple Datadog resources:
- Monitoring subscriptions in multiple Azure tenants – If you intend to link subscriptions spread across multiple tenants to the same Datadog organization, you will have to create at least one Datadog resource in each tenant.
- Owner access on only a subset of subscriptions – For example, if there are 3 subscriptions - SubA, SubB and SubC and you have Owner role assigned only on subscriptions A and B, you would only be able to add SubB through Monitored subscriptions in the Datadog resource created in SubA. If your team still intends to monitor SubC, someone with Owner role assigned to that subscription would need to create a separate resource in SubC.
Quickstart Template to create a new Datadog organization
Looking to simplify the process of configuring monitoring for your Azure subscription with Datadog? Look no further than the Quickstart template now available in the Azure code samples gallery! With just two steps, you can create a new monitoring resource and a Datadog organization with minimal configuration. This community-driven repository of ARM templates for commonly used workloads is a go-to resource for Azure customers looking to deploy resources quickly and easily.
The template creates a new Datadog organization on Datadog’s US3 site and is configured to send all Azure resource logs as well as subscription activity logs and all platform metrics for supported resource types (Except Virtual Machines, Virtual Machine Scale Sets and App Service Plans).
Currently, the only supported Azure region for deploying Datadog resources is West US 2. Additionally, the template is configured to subscribe to Datadog’s public Pay as you Go plan with a monthly billing frequency.
The template can be accessed via the following options:
- From the code samples gallery
- “Deploy a custom template” from the Azure Portal
The Quickstart template can be accessed here. Click on the Deploy to Azure button

After signing into the Azure portal, it lands you in the Basics tab of the template deployment flow.
Deploy a Custom Template
Alternatively, you can also search for and deploy the template within the Azure Portal:
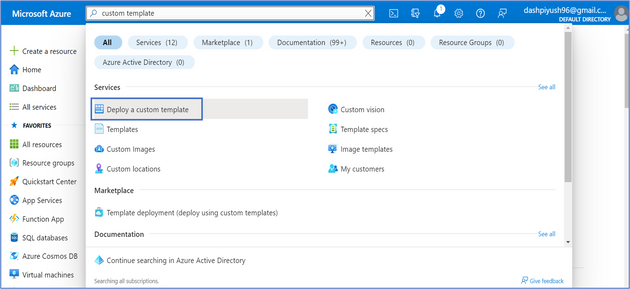
In the global search bar, search for “custom template”
Choose the “Deploy a custom template” option under Services
In the Custom Deployment experience that opens, retain the Template source as “Quickstart template” and in the dropdown below, search for “datadog”
Choose the resource type for Datadog that appears in the dropdown (quickstarts/microsoft.datadog/datadog) and then Click on “Select Template”.
The remaining steps are the same, irrespective of whether you started from the code samples gallery of the Deploy a custom template flow.
- In the Basics tab, choose the Subscription you want to create your Datadog resource in (You must have Owner role assigned on the subscription you choose)
- Provide the name of the resource group for the resource. If the name provided doesn’t match that of any existing resource group, a new resource group is created.
- Monitor Name is the name of the Datadog resource that would be created. It is prepopulated with a default pattern which you can override with a name of your choice.
- Location parameter defines where the resource is going to be deployed. Currently, the only supported region is West US 2.
- Plan and Billing Term fields are currently set to defaults (Datadog’s public Pay as you Go plan with a monthly billing frequency) and can’t be modified
Click on “Next” or “Review + create”
If the validation is successful, verify the details at the bottom. If the validation throws an error or you want to modify any field, go back to the previous step to make the necessary changes.
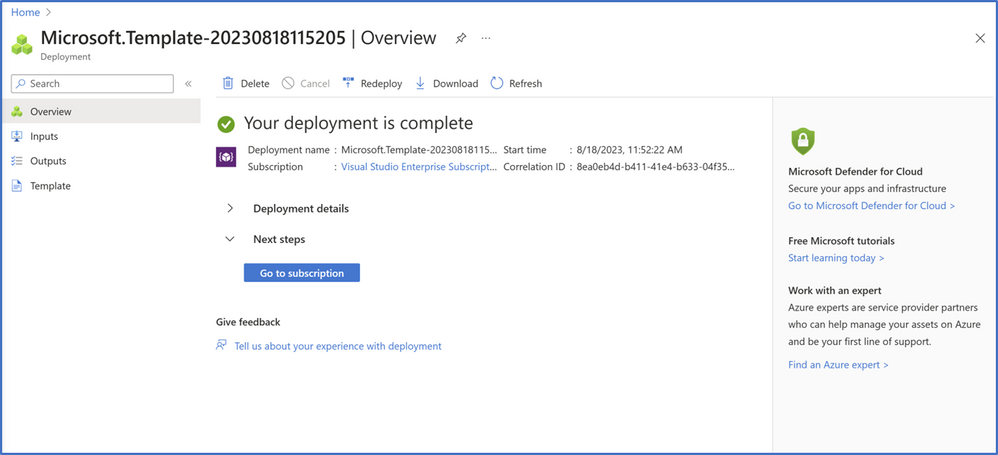
Click on Create. The deployment takes ~1-2 minutes to complete. You should see a confirmation screen regarding successful deployment.
You are all set! Go to your newly created Datadog resource and start monitoring the status of your Azure resources.
Collect Custom Metrics
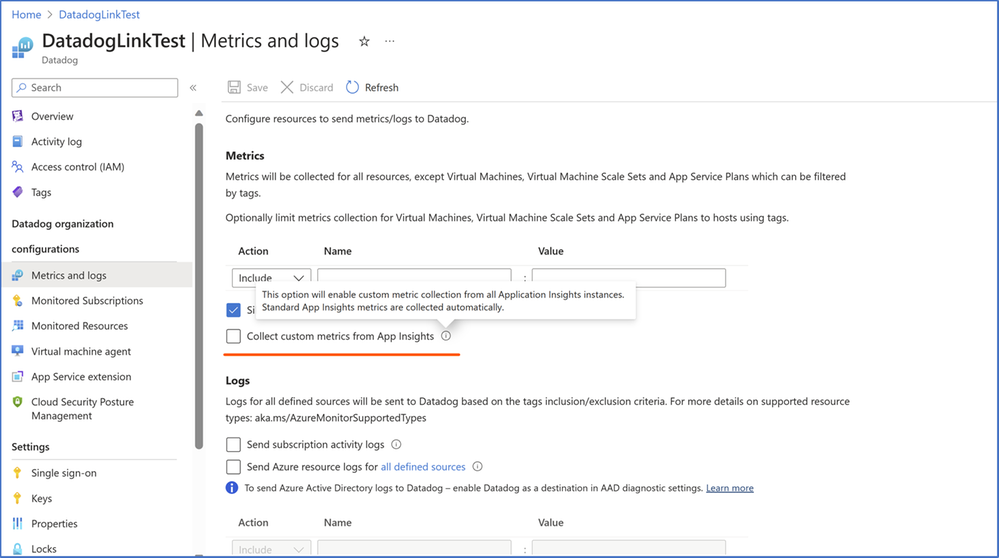
You can now enable collection of custom metrics from Azure Application Insights through your Datadog resource. In the Metrics and logs blade in your Datadog resource, simply enable the “Collect custom metrics from App Insights” and click on Save.
Suggest a Feature
We are always looking for ways to improve our product and make it even better for you. We would love to hear your suggestions for new features or improvements that you would like to see. To suggest a new feature, you can click on the Suggest a Feature button in your Datadog resource’s overview blade. This redirects to the Developer community forum where you can also view other feature suggestions from other customers and you can also upvote other posts and comment on them.
Happy monitoring!
Next Steps:
- If you would like to subscribe to the service, check out Datadog - An Azure Native ISV Service from Azure marketplace.
- If you already use Datadog – An Azure Native ISV Service, and have feedback or feature requests, please share in our feedback forum.
- To learn more about the service, check out our documentation- Get started with Datadog - An Azure Native ISV Service
You must be a registered user to add a comment. If you've already registered, sign in. Otherwise, register and sign in.

