First published on CloudBlogs on Jul, 19 2016
Howdy folks, We've just turned on the preview of Azure AD Connect Health for Windows Server AD. This new feature of Azure AD Premium gives IT admins the ability to monitor the health and performance of their on-premises Windows Server Domain Controllers from the cloud. This new capability has been a HUGE hit with our private preview customers and we're hoping you'll be excited as well. I've asked Arturo Lucatero, one of the Program Managers on the Azure AD Connect Health R&D team, to write a quick blog post on this cool new feature. You'll find his blog below. Hopefully you will find this new capability useful! And as always, we would love to receive any feedback or suggestions you have. Best Regards, Alex Simons (Twitter: @Alex_A_Simons ) Director of Program Management Microsoft Identity Division -------------------------------- Hello World, I'm Arturo Lucatero, a Program Manager on the Azure AD Connect Health team. Today, I'm pleased to announce the next addition to Azure AD Connect Health, which is monitoring for Active Directory Domain Services (AD DS.) While Azure AD Connect Health has the ability to monitor ADFS and Azure AD Connect (Sync), we knew that Active Directory Domain Services is a critical component and we wanted to make sure we gave you the same, easy, low-cost and insightful monitoring experience. Starting with the quick and simple onboarding process, Azure AD Connect Health for AD DS is here to improve your monitoring experience! Active Directory Domain Services was first introduced back in 1999 and is now the cornerstone for identity needs of most business organizations. Enabling a monitoring solution for Active Directory Domain Services is critical to a company's reliable access to applications. Introducing the ability to monitor your AD DS infrastructure from the cloud, opens many possibilities that weren't previously available with traditional box monitoring solutions. Let's take a look!
Howdy folks, We've just turned on the preview of Azure AD Connect Health for Windows Server AD. This new feature of Azure AD Premium gives IT admins the ability to monitor the health and performance of their on-premises Windows Server Domain Controllers from the cloud. This new capability has been a HUGE hit with our private preview customers and we're hoping you'll be excited as well. I've asked Arturo Lucatero, one of the Program Managers on the Azure AD Connect Health R&D team, to write a quick blog post on this cool new feature. You'll find his blog below. Hopefully you will find this new capability useful! And as always, we would love to receive any feedback or suggestions you have. Best Regards, Alex Simons (Twitter: @Alex_A_Simons ) Director of Program Management Microsoft Identity Division -------------------------------- Hello World, I'm Arturo Lucatero, a Program Manager on the Azure AD Connect Health team. Today, I'm pleased to announce the next addition to Azure AD Connect Health, which is monitoring for Active Directory Domain Services (AD DS.) While Azure AD Connect Health has the ability to monitor ADFS and Azure AD Connect (Sync), we knew that Active Directory Domain Services is a critical component and we wanted to make sure we gave you the same, easy, low-cost and insightful monitoring experience. Starting with the quick and simple onboarding process, Azure AD Connect Health for AD DS is here to improve your monitoring experience! Active Directory Domain Services was first introduced back in 1999 and is now the cornerstone for identity needs of most business organizations. Enabling a monitoring solution for Active Directory Domain Services is critical to a company's reliable access to applications. Introducing the ability to monitor your AD DS infrastructure from the cloud, opens many possibilities that weren't previously available with traditional box monitoring solutions. Let's take a look!

- Monitoring alerts to detect when domain controllers are unhealthy, along with email notifications for critical alerts.
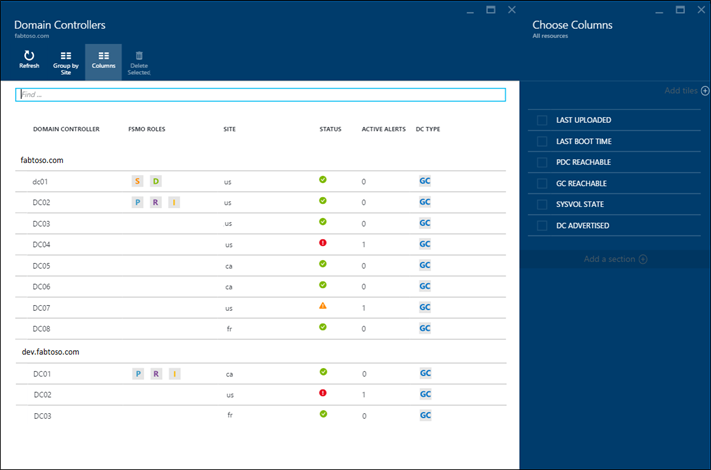
- Domain Controllers dashboard which provides a quick view into the health and operational status of your domain controllers.
- Replication Status dashboard with latest replication information, along with links to troubleshooting guides when errors are detected.
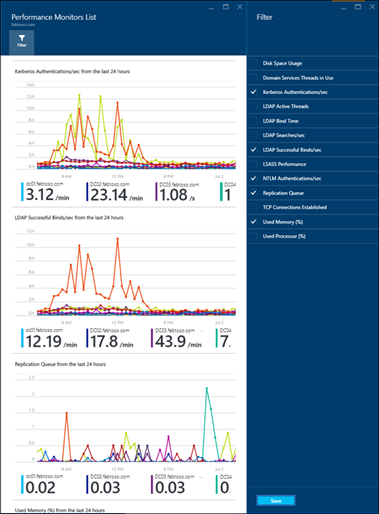
- Quick anywhere access to performance data graphs of popular performance counters, necessary for troubleshooting and monitoring purposes.
- RBAC controls to delegate and restrict access to the users managing AD DS.
Alerts
The Azure AD Connect Health for AD DS alerts, are intended to inform you when something is wrong in your environment. Whether a domain controller is unable to replicate successfully, not able to find a PDC, is not properly advertising or amongst many other issues, you can count on these alerts to inform you. Additionally, if you enable email notifications, you will receive these alerts straight to your inbox.

Domain Controllers Dashboard
This dashboard provides a unified lens into the health and operational status of your AD DS environment. We interviewed a number of domain admins and one of the challenges for them was the ability to have a quick glance view of their environment to detect hotspots. By presenting a topological view along with health status and key operational metrics of monitored DCs, this dashboard makes it quick and easy to identify any DCs that might require further investigation.

Replication Status Dashboard
Replication is one of the most critical processes that ensures that your environment is running smoothly. This dashboard provides a view of the Replication topology along with the latest replication attempt status, for your monitored DCs. If one or more of your DCs encountered an error during the latest replication, you will find helpful details and documentation links to assist with the remediation process.

Monitoring
The monitoring feature provides the ability to compare the performance of your monitored DCs against each other, as well as comparing different metrics of interest. Knowing these data points can be a critical item, when troubleshooting AD DS. Whether you are interested in knowing how your DCs are handling Kerberos Authentications per sec or knowing the Replication queue size, you can easily find these data points. This allows you to access to the performance data of your environment, completely from the cloud from anywhere in the world.

Video
The video below provides an overview of how to get starting using Azure AD Connect Health for AD DS, as well as a walkthrough of the features we've discussed. https://channel9.msdn.com/Series/Azure-Active-Directory-Videos-Demos/Azure-AD-Connect-Health-monitors-on-premises-AD-Domain-ServicesWhat's coming next?
- Additional alerts based on customer feedback and data from our support channel
- Additional performance metrics that help with monitoring your AD DS environment
Updated Jul 24, 2020
Version 5.0Alex Simons (AZURE) Microsoft
 Microsoft
Joined May 01, 2017
Microsoft Entra Blog
Follow this blog board to get notified when there's new activity