- Home
- Azure
- Azure Observability Blog
- Observability at scale – Azure Monitor Metrics Data Plane API
- Subscribe to RSS Feed
- Mark as New
- Mark as Read
- Bookmark
- Subscribe
- Printer Friendly Page
- Report Inappropriate Content
Azure offers customers the opportunity to scale infrastructure catering to their extensive workload requirements. However, effectively monitoring large deployments across various tenants and subscriptions has posed a challenge. To empower customers with seamless querying capabilities at scale, Microsoft Azure Monitor has introduced the Azure Metrics Data Plane API. This API became generally available to all Azure customers in January 2024.
To simplify the setup of observability using this newly released API, the Microsoft Cloud for ISVs & AI engineering team has developed an open-source observability solution that leverages the Azure Monitor Metrics Data Plane API. This solution enables users to query availability data for a limited set of services deployed across multiple tenants and subscriptions, facilitating efficient monitoring.
Batch API Sample Request
The following shows an example of a call to this API that would be filled in with information specific to your subscriptions and resources.
POST https://{region}.metrics.monitor.azure.com/subscriptions/{subscriptionID}/metrics:getBatch?timespan={timeSpan}&interval=PT1M&metricnames=Availability&aggregation=average&metricNamespace={resourceProvider}&autoadjusttimegrain=true&api-version=2023-03-01-preview

Additionally, the body of the request allows multiple resource IDs to be passed in:

{

  "resourceids": [

    "/subscriptions/12345678-abcd-1234-abcd-123456789abc/resourceGroups/TestGroup/providers/Microsoft.Storage/storageAccounts/TestStorage1",

    "/subscriptions/12345678-abcd-1234-abcd-123456789abc/resourceGroups/TestGroup/providers/Microsoft.Storage/storageAccounts/TestStorage2"

  ]

}
Batch API Sample Response
The availability data for all the given resource IDs in the time period will be returned by the API response. The following example highlights a single resource and has been edited for readability.
    {
      "timespan": "2024-03-05T12:46:00Z/2024-03-05T12:47:00Z",
      "interval": "PT1M",
      "value": [
{
  "id": "/subscriptions/12345678-abcd-1234-abcd-123456789abc/resourceGroups/TestGroup
/providers/Microsoft.Storage/storageAccounts/TestStorage1/providers/Microsoft.Insights/metrics/Availability",
"type": "Microsoft.Insights/metrics",
 "name": {
    "value": "Availability",
    "localizedValue": "Availability"
 },
"displayDescription": "The percentage of availability for the storage service or the specified API operation.
Availability is calculated by taking the TotalBillableRequests value and dividing it by the number of applicable requests, including those that produced unexpected errors. All unexpected errors result in reduced availability for the storage service or the specified API operation.",
 "unit": "Percent",
"timeseries": [
     {
       "timeStamp": "2024-03-05T12:46:00Z",
       "average": 100
      }
    ]
}
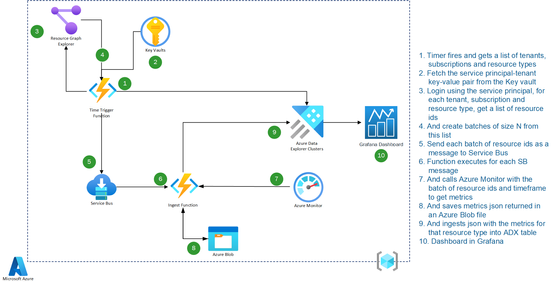
Here is the architecture that uses the Metric Data Plane API to enable querying at scale.
Availability Metrics
Currently, the following availability metrics are supported by this solution.
|
Resource Type |
Metric Name (Azure Monitor) |
Metric calculation |
|
AKS Server Node |
(Ready / Ready + Not Ready)) x 100 |
|
|
Load Balancer |
- |
|
|
Firewall |
- |
|
|
Storage |
- |
|
|
Cosmos DB |
- |
|
|
Key Vault |
- |
|
|
Event Hubs |
((IncomingRequests – ServerErrors) / Incoming Requests) x 100 |
|
|
Container Registry |
((Successful Push + Pull)/(Total Push + Pull)) x 100 |
|
|
Log Analytics |
- |
Here are some key features and benefits of utilizing this observability solution:
- Multi-tenancy and Subscription Support: This feature allows you to configure multiple tenants and subscriptions to monitor for supported resource types, making it easy to manage and monitor your resources across different environments.
- Real-time Metric Data Pull: With this feature, you can configure near real-time data pull with the minimum value limited to 60 seconds, ensuring that you have access to the latest data for timely decision-making.
- Deep Linking: This feature enables you to quickly navigate to resources to begin troubleshooting, saving you time and effort when investigating issues.
- Easy Setup with Terraform: The Observability solution uses Terraform for easy deployment and setup, making it simple and straightforward to get started with monitoring your resources.
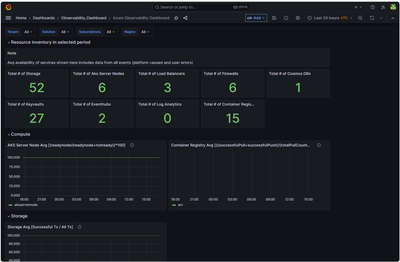
- Grafana Dashboard: Users can leverage preconfigured visuals within the Grafana dashboard to monitor the availability of the selected Azure Services.
The observability solution includes reference architecture, ready to deploy code. You can further customize the solution to include additional metrics to display on the Grafana dashboard.
To deploy the observability solution in your subscription, follow the deployment process described in this link.
You must be a registered user to add a comment. If you've already registered, sign in. Otherwise, register and sign in.

