- Home
- Azure
- Azure Observability Blog
- Introducing a unified Azure Monitor cloud native offering for Kubernetes monitoring
- Subscribe to RSS Feed
- Mark as New
- Mark as Read
- Bookmark
- Subscribe
- Printer Friendly Page
- Report Inappropriate Content
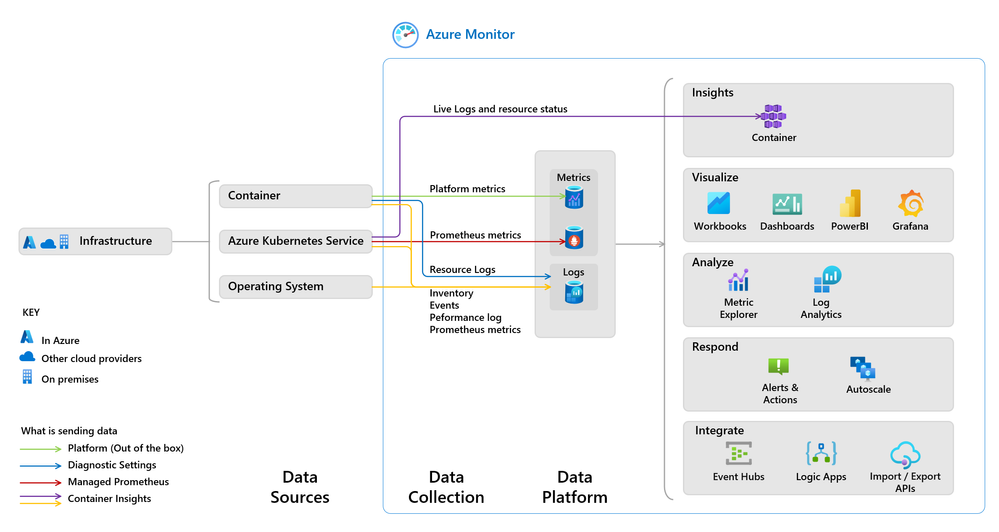
Azure Monitor now offers Managed Prometheus service alongside Azure Managed Grafana and Azure Monitor Container insights, fostering an ecosystem of open-source and vendor neutrality. Now you can get the power of cloud native monitoring tools with enterprise grade security and reliability of Azure Monitor.
What is Azure Monitor’s unified cloud native offering for Kubernetes monitoring?
We are excited to announce the preview for Azure Monitor managed service for Prometheus to monitor your Kubernetes cluster. But it is more than “just another service” to monitor your Kubernetes cluster. Managed service for Prometheus is deeply integrated with Azure Monitor tools. You can now set up end-to-end monitoring for your Kubernetes cluster without the headache of patching various tools and manual integrations. With Azure Monitor’s unified cloud native offering, you get:
- A fully managed service that handles ingestion, storage for long-term data retention and querying of your Prometheus metrics using Prometheus Query Language (PromQL) with Azure Monitor managed service for Prometheus.
- Advanced troubleshooting capabilities with Azure Monitor Container Insights that offers visualizations and troubleshooting logs of nodes, controllers, and containers.
- A full stack observability with Azure Managed Grafana by a single-click configuration to seamlessly link various data sources and get popular out-of-the-box Grafana dashboards
Get started with Azure Monitor’s cloud native offering
Getting started with Azure Monitor’s cloud native offering for Kubernetes monitoring is a breeze.
Once you create your Kubernetes cluster, you can enable monitoring using Azure portal, Azure resource manager templates and CLI. Using Azure portal, you can easily enable Prometheus metrics by selecting ‘Insights’ in your cluster view. You can store the Prometheus metrics in an Azure monitor workspace. Additionally, you can pick a log analytics workspace and enable logs collection for advanced troubleshooting. Finally, link your Grafana workspace (or create a new one) to visualize your monitoring data.
Once you configure, unleash the power of the cloud native capabilities for monitoring the Kubernetes cluster with Azure Monitor.
Open-source compatibility and portability for Prometheus metrics
Azure Monitor managed service for Prometheus is a fully managed service that handles ingestion for the native Prometheus metrics types. It is available to use on its own or as an integrated component of Azure Monitor container insights and Azure Managed Grafana. Additional benefits include:
- 18-month data retention for storage and PromQL based query service
- Highly available, scalable, and enterprise-grade secure service
- Easily enable managed Prometheus using our collector or use it as a drop-in replacement for self-managed Prometheus
- Retain your existing Prometheus configurations, recording rules and alert rules.
Monitor health and performance of your Kubernetes cluster with Azure Monitor container insights
Azure Monitor container insights collects critical logs, enables alerts to identify issues, and provides visualization to monitor health and performance of your Kubernetes cluster. It complements CNCF backed open-source tools for end-to-end Kubernetes monitoring including logs collection for advanced troubleshooting. Enabling container insights with managed Prometheus will open possibilities such as:
- Correlating spikes in Prometheus metrics with troubleshooting logs for Kubernetes cluster
- Identifying capacity needs and determining the maximum load that the cluster can sustain by understanding the behavior of the cluster under average and heaviest loads
- Advanced diagnostics with collection of container logs (stdout/stderror), events, and pod metrics
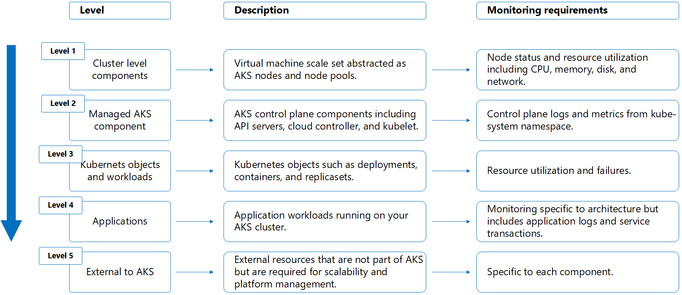
We understand that your monitoring needs may vary depending on scale, topology, organizational roles, and multi-cluster tenancy. Learn more about the best practices for monitoring each layer starting from infrastructure up through applications with Prometheus metrics and logs collected with container insights.
Get full stack observability with Azure Managed Grafana
Getting the right monitoring data is halfway through to get started with monitoring. It is imperative to have a single pane of glass to determine the performance issues and quickly mitigate them. Azure Managed Grafana is integrated with Azure Monitor and allows you to get full stack observability from multiple data sources on a single screen. With Azure Managed Grafana, you can:
- Get popular Grafana dashboards out-of-the-box for the Prometheus metrics
- Easily add your existing Grafana dashboards or Azure Monitor visualizations in a single view
- Combine application metrics and infrastructure metrics from various data sources into a single dashboard for full stack visibility
- Add Grafana dashboards from the open-source community
That is all you need to get started with Kubernetes monitoring on Azure Monitor. We’d love to hear what you like and don’t like about this feature, and where you’d like us to take it. Please provide feedback on Azure Monitor Community under Managed Prometheus category. If you wish to learn more, you can always find a great ton of learning content in our documentation.
Learn more
Azure Monitor managed service for Prometheus (preview) | Microsoft Learn
Overview of Container insights - Azure Monitor | Microsoft Learn
Quickstart: create an Azure Managed Grafana instance using the Azure portal | Microsoft Learn
Monitor Azure services and applications using Grafana - Azure Monitor | Microsoft Learn
You must be a registered user to add a comment. If you've already registered, sign in. Otherwise, register and sign in.


