- Home
- Azure
- Azure Observability Blog
- How To Monitor Your Multi-Tenant Solution on Azure With Azure Monitor
- Subscribe to RSS Feed
- Mark as New
- Mark as Read
- Bookmark
- Subscribe
- Printer Friendly Page
- Report Inappropriate Content
1. Multi Tenant solution
Often customers are operating using a multi-tenant architecture in Azure for several reasons: cost-effectiveness, scalability and security. However, this architecture will make it challenging to get an overview of the status of resources across the different tenants. E.g., an application with different instances of it running across multiple tenants. The person responsible for the performance and operational effectiveness of the application will have a hard time monitoring the status of each of these instances. In an ideal scenario, this person would be able to assess all this information from a single pane of glass instead of having to log into each tenant to retrieve this data.
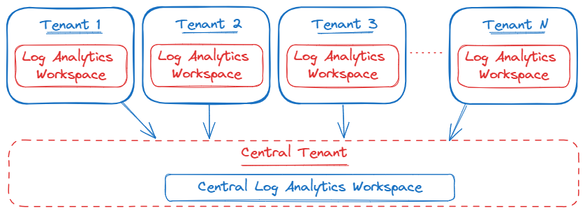
Given the scenario above, it is not possible to send log data from resources in tenant A to a Log Analytics Workspace in tenant B. A possible solution to address this challenge is to use the Hybrid model when implementing your Log Analytics Workspace architecture.
“In a Hybrid model, each tenant has its own workspace. A mechanism is used to pull data into a central location for reporting and analytics. This data could include a small number of data types or a summary of the activity, such as daily statistics.”
In order to centralize the data in a multi-tenant solution, there are two options:
- Create a central Log Analytics Workspace. To query and ingest the data into this location, one can use either the Query API and the logs Ingestion API or use Azure Logic Apps to centralize the data.
- Using the integration between Log Analytics Workspace and Power BI by exporting the KQL query to PowerBI.
For the sake of this article, we will focus on the first option, namely creating a central Log Analytics Workspace by leveraging the Log Query and Ingestion API. However, as discussed above, there are different approaches one could choose from. A high level architecture of this approach would look like the following:

In the remainder of this article, we will provide a step by step tutorial on how this hybrid model can be implemented using Azure Services. Programming language used in the article is Python. However, other programming languages are supported as well, such as: .NET, Go, Java or JavaScript.
2. Practical implementation
The first step is to configure your centralized Log Analytics Workspace environment by setting up the following:
- Create a new central Log Analytics Workspace
- Create a Microsoft Entra application
- Create a Data Collection Endpoint (DCE) and Data Collection Rule (DCR)
- Create a custom table in the centralized Log Analytics Workspace
The steps outlined above are explained in the following tutorial:
Tutorial: Send data to Azure Monitor Logs with Logs ingestion API (Azure portal) — Azure Monitor | M....
In terms of authentication, take the following into account:
- To gain access to the Log Analytics Workspace for querying data, here are the captivating steps:
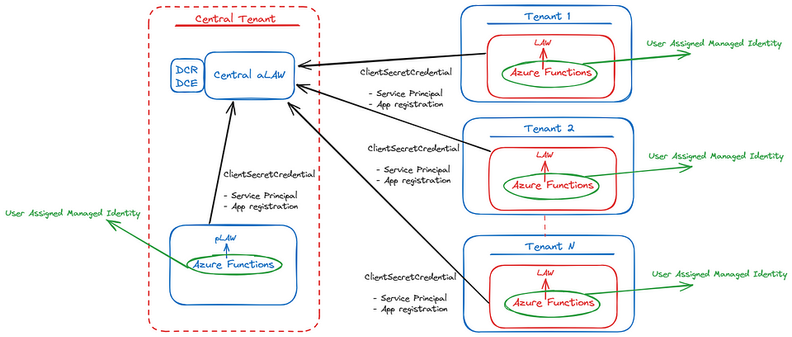
- User Assigned Managed Identity: how to create a User Assigned Managed Identity
Note: make sure to add the Monitoring Metrics Publisher: Enables publishing metrics against Azure resources - Authenticate into the central Log Analytics Workspace for data ingestion with these possible authentication approaches:
- Azure Lighthouse: enables multitenant management with scalability, higher automation, and enhanced governance across resources
- Service Principal + App registration: as used in the tutorial
Both methods will accomplish the task; hence, it depends on the company’s security policies and requirements to decide which solution to use. However, in this article the Service Principal + App registration has been used.
After the central Log Analytics Workspace has been created and the right authentication method has been selected, the next step will be to start writing the script. From a high level point of view, the script will query the Log Analytics Workspace inside the tenant where it will be deployed. Next, it will take the results of the query and ingest them into the centralized Log Analytics Workspace created in previous steps.
As mentioned, the programming language used in this article is Python. The same goal can be achieved using different programming languages such as .NET, Go, Java, JavaScript.
A more detailed architecture would look like this:
3. Getting Started
Step 1: Required imports
import logging
import os
import sys
from datetime import datetime, timezone
import json
import pandas as pd
from azure.core.exceptions import HttpResponseError
from azure.identity import ManagedIdentityCredential, ClientSecretCredential
from azure.monitor.ingestion import LogsIngestionClient
from azure.monitor.query import LogsQueryClient, LogsQueryStatus
Step 2: Set variables required further in the script
# Get information from the centralized Log Analytics Worspace and DCR/DCE created
LOGS_WORKSPACE_ID = os.environ['LOGS_WORKSPACE_ID']
DATA_COLLECTION_ENDPOINT = os.environ['DATA_COLLECTION_ENDPOINT']
LOGS_DCR_RULE_ID = os.environ['LOGS_DCR_RULE_ID']
LOGS_DCR_STREAM_NAME = os.environ['LOGS_DCR_STREAM_NAME']
# Get information from the created Service Principal created
AZURE_CLIENT_ID = os.environ['AZURE_CLIENT_ID']
AZURE_TENANT_ID = os.environ['AZURE_TENANT_ID']
AZURE_CLIENT_SECRET = os.environ['AZURE_CLIENT_SECRET']
# Get client ID from User Assigned Managed Identity (UA_MI)
AZURE_UA_MI_CLIENT_ID = os.environ['AZURE_UA_MI_CLIENT_ID']
Step 3: Configure credentials
# Configure credentials
credential_mi = ManagedIdentityCredential(AZURE_UA_MI_CLIENT_ID)
credential = ClientSecretCredential(AZURE_TENANT_ID, AZURE_CLIENT_ID, AZURE_CLIENT_SECRET)
Step 4: Configure Query and Ingestion clients
# Create clients
logs_query_client = LogsQueryClient(credential_mi)
ingestion_client = LogsIngestionClient(endpoint=DATA_COLLECTION_ENDPOINT, credential=credential, logging_enable=True)
Step 5: Define the KQL query you want to run against the Log Analytics Workspace (results of this will be ingested into the centralized workspace)
# Define query and time span (example)
query = """<Your KQL query>"""
start_time = datetime(2024, 1, 11, tzinfo=timezone.utc)
end_time = datetime(2024, 1, 20, tzinfo=timezone.utc)
Step 6: Query Log Analytics Workspace and put results into a list of JSON objects (which is required for the ingestion of the data)
# Query Log Analytics Workspace
response = logs_query_client.query_workspace(
    LOGS_WORKSPACE_ID,
    query=query,
    timespan=(start_time, end_time)
)
if response.status == LogsQueryStatus.PARTIAL:
    error = response.partial_error
    data = response.partial_data
    print(error)
elif response.status == LogsQueryStatus.SUCCESS:
    data = response.tables
# Convert data to JSON list
json_list = []
for table in data:
    df = pd.DataFrame(data=table.rows, columns=table.columns)
    # Use f-string for string formatting
    print(f"Dataframe:\n{df}\n")
    # Use list comprehension for creating list
    json_list.extend([json.loads(row) for row in df.to_json(orient="records", lines=True).splitlines()])
    # Use f-string for string formatting
    print(f"JSON list:\n{json_list}\n")
Step 7: Take the results and ingest them into the centralized Log Analytics Workspace
#Upload logs
ingestion_client.upload(rule_id=LOGS_DCR_RULE_ID, stream_name=LOGS_DCR_STREAM_NAME, logs=json_list)
print("Upload done")
The full script:
import logging
import os
import sys
from datetime import datetime, timezone
import json
import pandas as pd
from azure.core.exceptions import HttpResponseError
from azure.identity import ManagedIdentityCredential, ClientSecretCredential
from azure.monitor.ingestion import LogsIngestionClient
from azure.monitor.query import LogsQueryClient, LogsQueryStatus

# Get information from the centralized Log Analytics Worspace and DCR/DCE created
LOGS_WORKSPACE_ID = os.environ['LOGS_WORKSPACE_ID']
DATA_COLLECTION_ENDPOINT = os.environ['DATA_COLLECTION_ENDPOINT']
LOGS_DCR_RULE_ID = os.environ['LOGS_DCR_RULE_ID']
LOGS_DCR_STREAM_NAME = os.environ['LOGS_DCR_STREAM_NAME']

# Get information from the created Service Principal created
AZURE_CLIENT_ID = os.environ['AZURE_CLIENT_ID']
AZURE_TENANT_ID = os.environ['AZURE_TENANT_ID']
AZURE_CLIENT_SECRET = os.environ['AZURE_CLIENT_SECRET']

# Get client ID from User Assigned Managed Identity (UA_MI)
AZURE_UA_MI_CLIENT_ID = os.environ['AZURE_UA_MI_CLIENT_ID']

# Configure credentials
credential_mi = ManagedIdentityCredential(AZURE_UA_MI_CLIENT_ID)
credential = ClientSecretCredential(AZURE_TENANT_ID, AZURE_CLIENT_ID, AZURE_CLIENT_SECRET)

# Create clients
logs_query_client = LogsQueryClient(credential_mi)
ingestion_client = LogsIngestionClient(endpoint=DATA_COLLECTION_ENDPOINT, credential=credential, logging_enable=True)

# Define query and time span (example)
query = """<Your KQL query>"""
start_time = datetime(2024, 1, 11, tzinfo=timezone.utc)
end_time = datetime(2024, 1, 20, tzinfo=timezone.utc)

try:
    # Query Log Analytics Workspace
    response = logs_query_client.query_workspace(
        LOGS_WORKSPACE_ID,
        query=query,
        timespan=(start_time, end_time)
    )
    if response.status == LogsQueryStatus.PARTIAL:
        error = response.partial_error
        data = response.partial_data
        print(error)
    elif response.status == LogsQueryStatus.SUCCESS:
        data = response.tables

   # Convert data to JSON list
    json_list = []
    for table in data:
        df = pd.DataFrame(data=table.rows, columns=table.columns)
        # Use f-string for string formatting
        print(f"Dataframe:\n{df}\n")
        # Use list comprehension for creating list
        json_list.extend([json.loads(row) for row in df.to_json(orient="records", lines=True).splitlines()])
        # Use f-string for string formatting
        print(f"JSON list:\n{json_list}\n")

    # Upload logs
    ingestion_client.upload(rule_id=LOGS_DCR_RULE_ID, stream_name=LOGS_DCR_STREAM_NAME, logs=json_list)
    print("Upload done")

except HttpResponseError as e:
    # Use f-string for string formatting
    print(f"Upload failed: {e}")
Step 8: Azure Functions
Once the script is written and runs locally, the next step will be to deploy this to the cloud and automate this. For this, multiple approaches are possible: Azure Logic Apps, Azure Functions, Azure Automation, PowerShell… In this article we deployed the script as an Azure Function and used the Timer Trigger in order to run the Function at a predefined interval (e.g., every 5 minutes). We deployed the function inside the tenant of the workspace we are going to query.
How to get started with Azure Functions:
- Create a function in Azure that runs on a schedule | Microsoft Learn
- Develop Azure Functions using Visual Studio | Microsoft Learn
- Timer trigger for Azure Functions | Microsoft Learn
- Continuously update function app code using Azure Pipelines | Microsoft Learn
Important: add the User Assigned Managed Identity created above to the identity settings of the Function App. This is required for the Function to be authenticated to Query the Log Analytics Workspace.
Step 9: (Optional) Visualization
After consolidating data from various resources in different tenants, creating visualizations could add an interesting dimension. Microsoft Azure offers multiple tools to do this:
- PowerBI
- Dashboards
- Workbooks
- Grafana
Step 10: (Optional) Create Log Alert Rules
Once the data has been centralized across different tenants, one could start to create Log Alert Rules. The alert rule is based on a log query that will run automatically at regular intervals. Based on the results of the query, Azure Monitor will determine if an alert — linked to the query — should be created and fired.
3. Security considerations
This solution relies on client secrets for authentication via the Service Principal and App Registration. To uphold robust security, our system enforces the expiration and periodic renewal of these critical credentials, mitigating potential vulnerabilities. It is essential to maintain vigilant monitoring to proactively detect and address any issues stemming from expired secrets, thereby avoiding disruptions to the solution’s functionality.
To streamline this process, we recommend integrating with Logic Apps, providing an automated and centralized solution for secret management. For further details on this integration, refer to following article:
Use Azure Logic Apps to Notify of Pending AAD Application Client Secrets and Certificate Expirations...
This approach not only enhances security practices but also guarantees an efficient and proactive handling of sensitive information.
You must be a registered user to add a comment. If you've already registered, sign in. Otherwise, register and sign in.
