- Home
- Azure
- Azure Infrastructure Blog
- Azure Arc, Azure Monitoring and Azure Workbooks
- Subscribe to RSS Feed
- Mark as New
- Mark as Read
- Bookmark
- Subscribe
- Printer Friendly Page
- Report Inappropriate Content
Overview
This blog discusses an overall approach for monitoring very commonly encountered uscases e.g. performance monitoring for CPU, disk, network, port connections, service status for hybrid VMs that are connected to Azure Arc.
Planning and Strategy for monitoring large scale hybrid servers
Some of the recommendations around planning before onboarding servers are as follows:
-
Create a Server Inventory List:
- Begin by creating a comprehensive list of servers that need to be onboarded to Azure Arc for monitoring. This inventory will serve as a foundation for your deployment strategy.
-
Resource Group Planning:
- Think ahead about resource groups for onboarding to Azure Arc. Strive for a balance—avoid having too many or too few resource groups. Logical grouping of servers within resource groups is essential. When writing monitoring queries, these groups will facilitate easier visualization of results.
- Tip: Do not onboard all servers into a single resource group at once. Instead, distribute them logically across multiple resource groups.
-
Resource Tagging for Subdivision:
- If further subdivision is needed within resource groups, leverage Resource Tags. Common examples of tags include hosting region, data center name, application name, and cost center.
-
Monitoring Requirements:
- Identify the specific monitoring requirements for each server in your inventory. Consider metrics such as performance monitoring, services, event logs, and system logs.
-
Health Indicators with Color Coding:
- Implement color coding themes (e.g., red, green, yellow) to indicate health status based on predefined thresholds. This visual approach helps quickly assess resource health.
-
Choose the Right Visualization Tool:
- Based on end-user access patterns, select an appropriate visualization tool:
- Azure Dashboards: Ideal for Azure Portal users who prefer a streamlined experience.
- Power BI: Consider this option if Azure Portal access cannot be granted to users. Note that Azure Workbooks may not be suitable in this scenario.
- Based on end-user access patterns, select an appropriate visualization tool:
-
RBAC Strategy for Dashboard Users:
- Define a Role-Based Access Control (RBAC) strategy for dashboard users. Grant permissions to create, use, and visualize workbooks and dashboards effectively.
-
Log Analytics Workspace Strategy:
- Decide on a log analytics workspace strategy for log collection:
- Existing Workspaces: Customers can use existing workspaces.
- Create a New Workspace: If needed, create a new workspace.
- Keep chargeback considerations and commitment tiering of the workspace in mind. Log analytics also gives you the ability to query across workspaces.
- Decide on a log analytics workspace strategy for log collection:
- Enable Insights and Log Collection: Enable logging and monitoring for the servers to capture the metrics in log analytics workspaces. This step will install the Azure Monitoring Agent for log and metric collection to log analytic workspaces.
- Plan for Data Collection Rules: Data collection rules will be needed to define the data sources and type of log to be collected for the monitored resources and help sending logging information to log analytics workspaces.
Large scale Resource Tagging in Azure
Large scale resource tagging in Azure can be achieved using a combination of CSV file and a script. A script can be used to discover and dump resources in CSV file. Next step is to modify and clean the CSV file for resources where tags need to be enforced. You may chose to remove the resources where tagging is not needed to be enforced. After modifying the CSV use a script to tag the resources in the CSV file.
Configure filters, tabs and groups in Azure Workbooks for data extraction and visualization
In the workbook example below, subscriptions, resource groups, workspaces, time range and tags have been used as filtering criteria.
Filters are defined using parameters in workbooks.
Create workbook parameters - Azure Monitor | Microsoft Learn
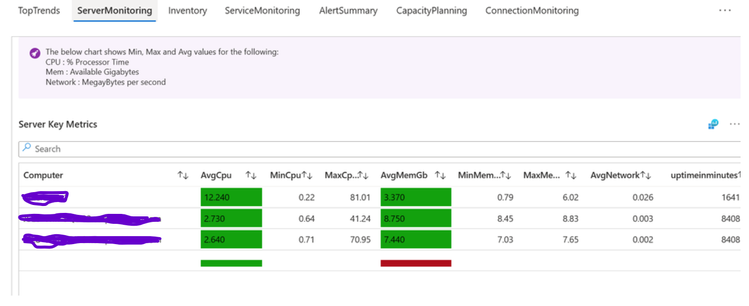
TopTrends, ServerMonitoring, Inventoy, ServiceMonitoring, AlertSummary, CapacityPlanning are tabs which will contain the visualised data. This will further contain groupings to keep correlated visualizations together.
Define Monitoring Requirements For VMs (Windows and Linux Use Cases)
Performance Monitoring:
Near real time monitoring of all PerfMon counters for Windows and Linux which can be collected at OS level for capacity and availability planning e.g. CPU, memory, uptime, network.
How to Enable VM Insights for log collection:
Tutorial - Monitor a hybrid machine with Azure Monitor VM insights - Azure Arc | Microsoft Learn
Define Data Collection Rules for Data Sources and Data Resources
In the example below data collection rules have been define for Performance Counters and windows event logs
Source of Data Visualization: Log analytics Perf and heartbeat table.
Disk Space utilization
Source of Data collection: Log Analytics Perf Tables
Change Tracking for Windows and Linux OS
Change tracking for windows and linux OS will keep a track of any changes on the system. Popular usecase in this category is services monitoring.
How to enable Change Tracking and Create Data Collection Rules for onboarded VMs
Change Tracking, Azure Arc, Multicloud, Windows, Enable change tracking (microsoft.com)
Source of Data collection: Log Analytics Table ConfigurationChange by enabling ChangeTracking using Azure Policy as documented below.
Adaptive customizable thresholding
Dynamic threshold capability is available in Azure Monitor which adapts the threshold value based on the past behaviour patterns for configured alerts. This capability is powered by machine learning. Some metrics may or may not be supported for customised thresholding.
Inventory details of onboarded servers
Inventory information such as serial number, model, properties, IP addresses, processor count, core count is captured by the agent and sent to the control plane in JSON format. Customers can choose the inventory details they want to project on the dashboard for monitoring.
Source of data collection: Azure Resource graph explorer type microsoft.hybridcompute/machines. For azure native VMs use microsoft.compute/machines
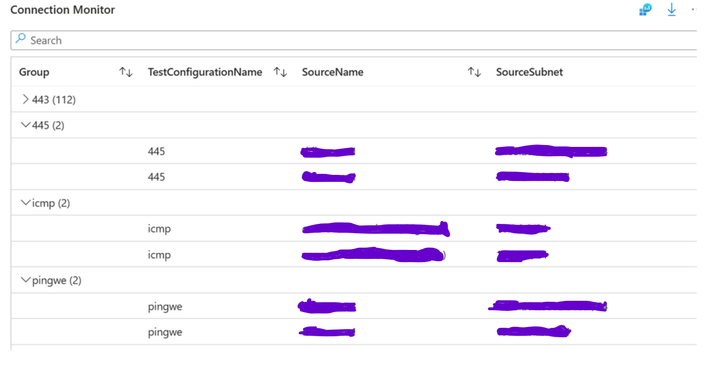
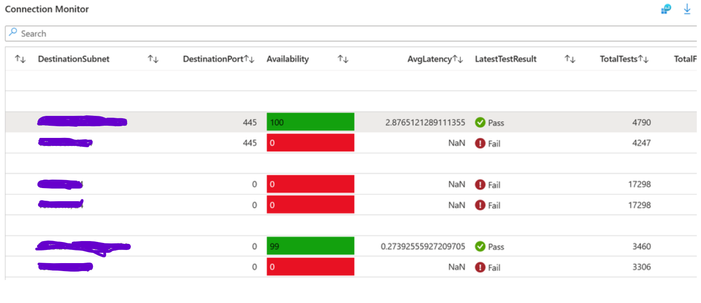
Port Monitoring through Network Connection Monitor
Monitoring connectivity from source to destination for ports such as 443, 445 source and destination subnets, availability, latency.
How to enable network connection Monitor for log collection
Source for data collection: Log Analytics table NWConnectionMonitorTestResult
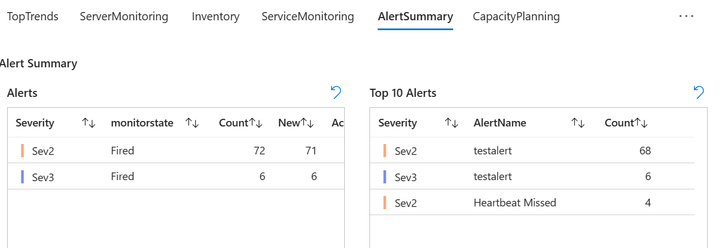
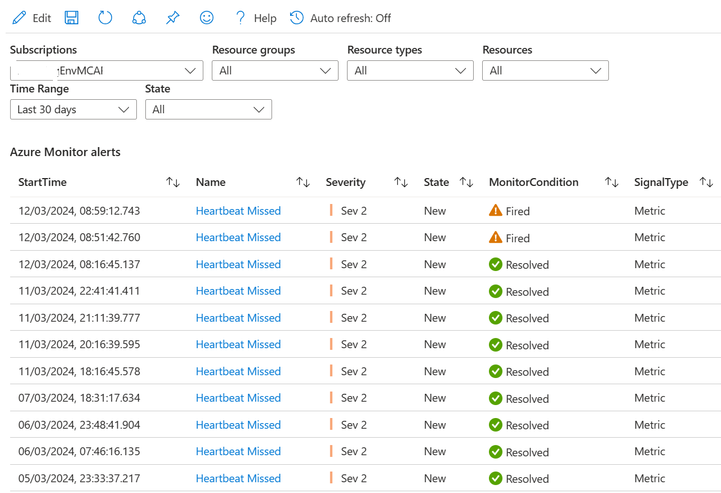
Alert Management workbooks for visualization
Visualization dashboards for Alerts can be created on Azure monitor to manage and track all alerts on one single view as shown below
Source for data collection: Azure Resource Graph query AlertsManagementResources type microsoft.alertsmanagement/alerts
Technical Skills Needed
A good understanding of KQL queries for log analytics, Azure resource Graph and creating effective workbooks.
References:
Azure Monitor workbook chart visualizations - Azure Monitor | Microsoft Learn
Kusto Query Language (KQL) overview - Azure Data Explorer & Real-Time Analytics | Microsoft Learn
Overview of Azure Resource Graph - Azure Resource Graph | Microsoft Learn
You must be a registered user to add a comment. If you've already registered, sign in. Otherwise, register and sign in.


