- Home
- Azure Data
- Azure Database for MySQL Blog
- Performance diagnostics for Azure Database for MySQL - Flexible Server
- Subscribe to RSS Feed
- Mark as New
- Mark as Read
- Bookmark
- Subscribe
- Printer Friendly Page
- Report Inappropriate Content
Database monitoring and troubleshooting is critical for any data driven application to detect issues faster and mitigate them as quickly as possible. The most difficult area to troubleshoot is being able to identify and address MySQL database performance issues. To help database administrators and developers to identify performance issues bottlenecks, in the Azure portal, there is a new Performance diagnostics feature designed to help manage Azure Database for MySQL servers. This feature takes advantage of MySQL’s information_schema and performance_schema databases to provide a comprehensive view of the system's internal operations. The data from performance schema helps to diagnose performance issues and identify bottlenecks.
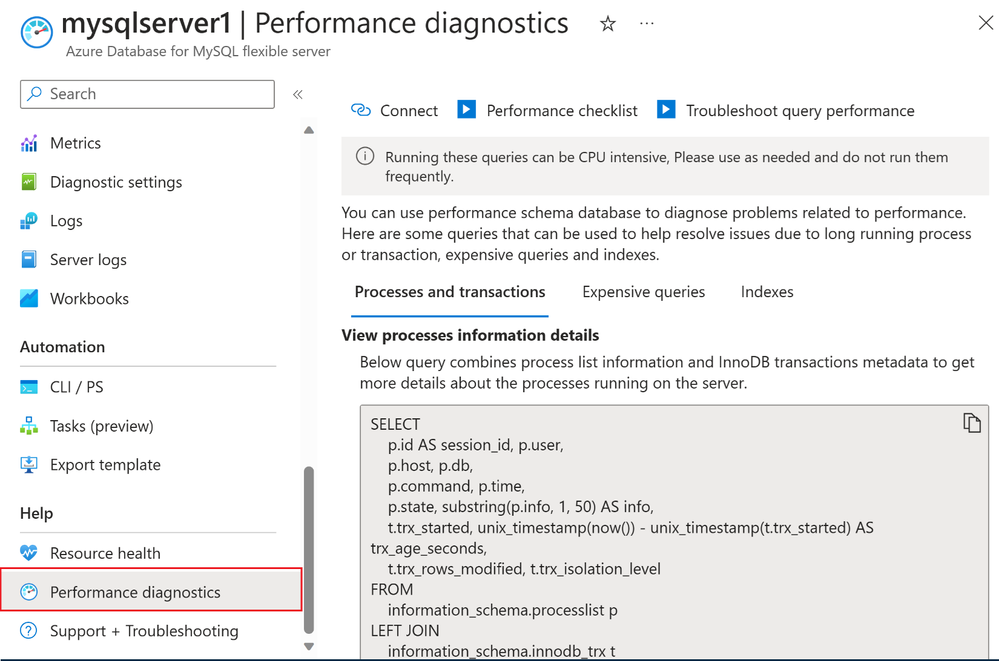
To access the functionality, in the Azure portal, navigate to an Azure Database for MySQL flexible server, and then, under Help, select Performance diagnostics:
Identifying performance issues
The performance diagnostics feature includes three tabs: Processes and transactions, Expensive queries, and Indexes. Additional information about these pages is provided in the following sections.
The Processes and transactions tab
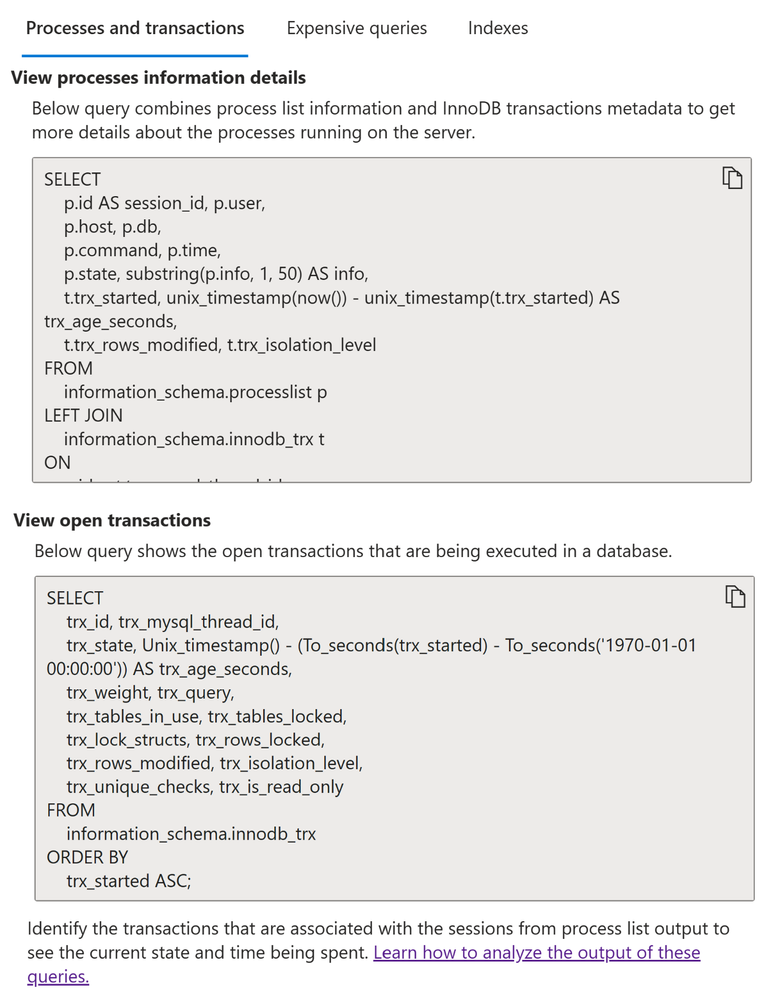
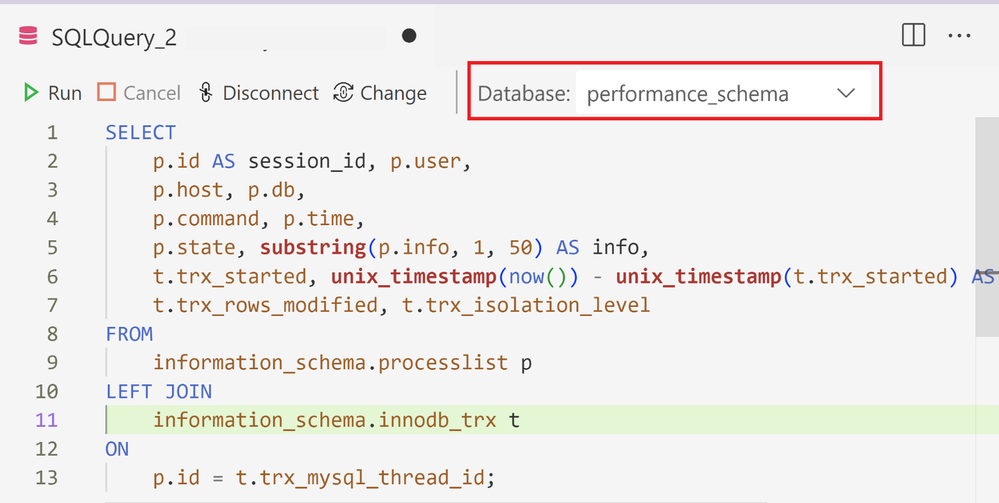
This tab shows you queries that can help you identify long running processes and transactions. You can get this information from the following two tables:
- INFORMATION_SCHEMA.PROCESSLIST table: You can get the server’s process list from this table.
- INFORMATION_SCHEMA.INNODB_TRX: You can get InnoDB’s transaction metadata from this table.
An accurate description of the connection and transaction state requires using information from both sources, for example, because the process list doesn’t indicate whether or not there’s an open transaction associated with any the session, while the transaction metadata doesn’t show session state and time spent in that state.
To mitigate or debug further, consider the following recommendations:
- Avoid large or long-running transactions by breaking them into smaller transactions.
- Create an alert for “Host CPU Percent” so that you get notifications if the system exceeds any of the specified thresholds.
- Use Query Performance Insights to identify and then optimize any problematic or slowly running queries.
The Expensive queries tab
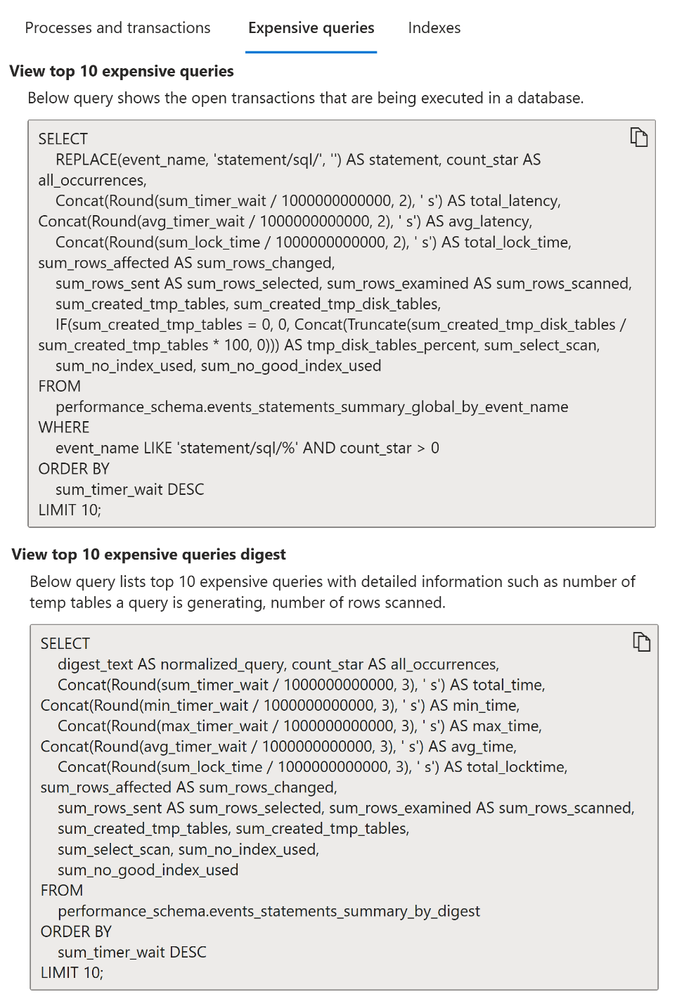
This tab shows all the expensive queries that are running on your MySQL flexible server instance. There could be a lot of queries from your application being executed on the MySQL server. Therefore, you can always create a digest so that the most relevant information for the expensive queries with the highest execution time.
To mitigate or debug further, consider the following recommendations:
- Use covering indexes to speed up your queries. A covering index is a regular index that provides all the data required for a query without having to access the actual table. It removes the need to access the actual table, saving a second trip to get the rest of the data.
- You can use an EXPLAIN statement to analyze your queries and optimize it.
- Learn how to troubleshoot query performance issues.
The Indexes tab
This tab shows queries that can help you identify unused indexes. When unused indexes are present, you may see symptoms of high I/O usage on your server metrics. These unused indexes consume storage and can have a negative impact on performance as they consume disk space, cache, and slow write operations (INSERT / DELETE / UPDATE). As table data is modified, the indexes also need to be updated.
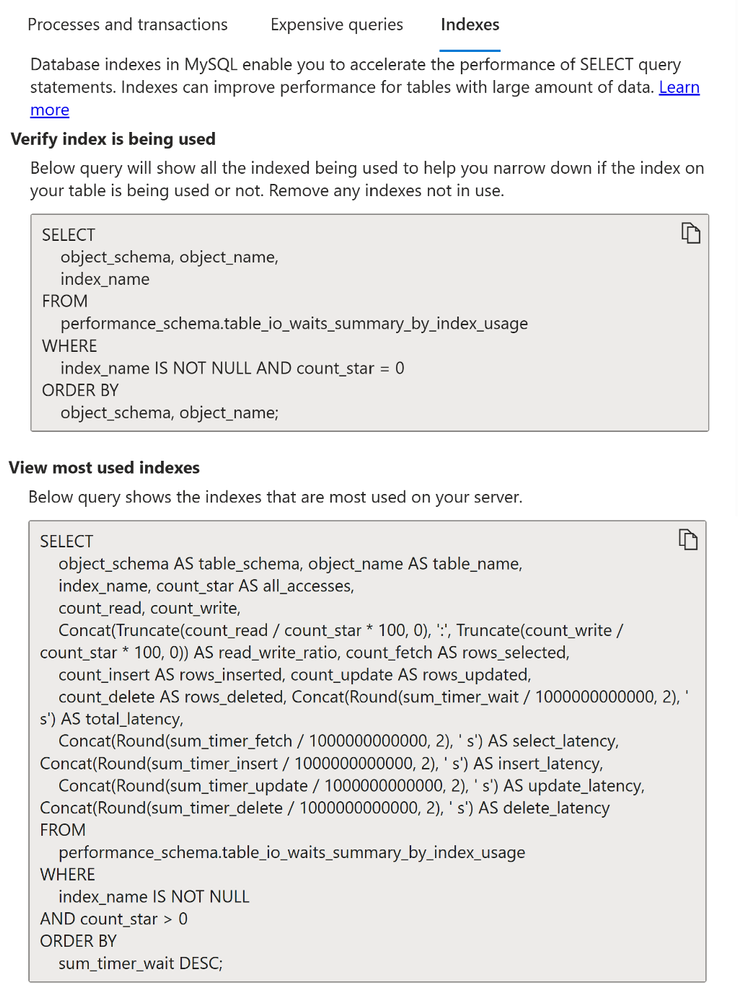
Remove unused indexes after verifying that the index is not being used. Be sure to avoid inadvertently removing an index that might be critical for a query that runs only quarterly or annually. Also, be sure to consider that some indexes are used to enforce uniqueness or ordering.
Running queries in performance diagnostics
Based on your networking configuration, you can run the queries using the Azure cloud shell and/or any MySQL client tool.
- For a MySQL flexible server with public access, select Connect to run the query in the portal using Azure cloud shell. You can also run the queries in Azure data studio, MySQL workbench, or MySQL command line tool.

- For MySQL flexible servers with private access servers using VNET injections, Azure cloud shell is not supported. Hence you would need to copy and run these queries using a MySQL command line tool. Remember to select ‘performance schema’ as your database before running the query.
Conclusion
Using these queries, MySQL developers and DBAs can gather information to help pinpoint performance bottlenecks, optimize queries, and enhance the overall efficiency of their database applications. Regularly analyzing and interpreting the data from the performance schema contributes to proactive performance management and ensures that your MySQL database continues to function optimally.
If you have any suggestions for improving the performance diagnostics experience for MySQL flexible servers, please leave a comment below or email us at AskAzureDBforMySQL@service.microsoft.com.
To learn more about what's new with Flexible Server, see What's new in Azure Database for MySQL - Flexible Server. Also be sure tune in for all of our updates and announcements by following us on social media: YouTube | LinkedIn | Twitter.
You must be a registered user to add a comment. If you've already registered, sign in. Otherwise, register and sign in.