- Home
- Artificial Intelligence and Machine Learning
- AI - Machine Learning Blog
- AzureML Observability: a scalable and extensible solution for ML monitoring and drift detection
- Subscribe to RSS Feed
- Mark as New
- Mark as Read
- Bookmark
- Subscribe
- Printer Friendly Page
- Report Inappropriate Content
In machine learning systems, monitoring is one of the most critical components to deal with potential drifts in data and model's concept. While there has been a good amount of literature to discuss various drift detection techniques, it remains difficult to operationalize an end to end solution. Some typical challenges are:
- To effectively monitor model and data drift, data from training and production needs to be correlatable. Ideally there's a centralized datastore service that can collect and analyze data from all stages in machine learning model life cycle.
- Machine learning pipeline may span across multiple technologies. For example, a data preparation step may utilize Synapse engine, while core machine learning training step occurs at Azure Machine Learning service, and the model may be deployed to a Databricks scoring job, depending on customers' needs and the strength of the technology at each stage.
- Data volume and velocity: Batch scoring can produce large amount of batched data while online scoring service can produce high volume of small messages. Then these in turn generate pressure for monitoring and drift analysis.
- Variability of data science and business domain: depending on customer scenario, data science and business domains, a particular data drift algorithm might work better than others.
To address these challenges, we created Azure ML Observability library/solution accelerator that supports end to end data collection, monitoring and drift analysis. The library is extensible to plug in different drift detectoin algorithms and runs on top of the scalable Azure Data Explorer.
The library is available at microsoft/AzureML-Observability: Scalable solution for ML Observability (github.com)
1. Solution Overview
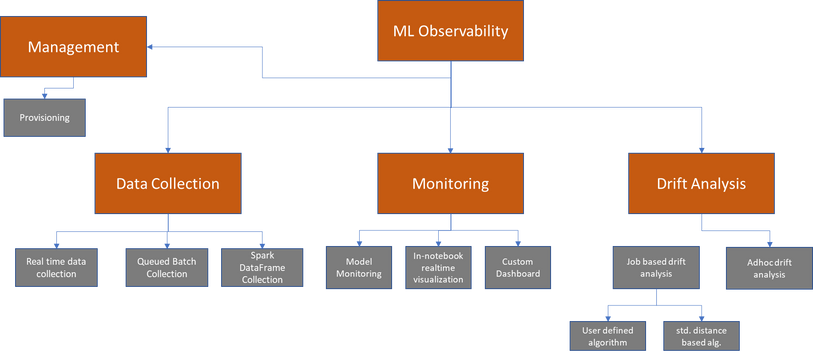
There are 4 main components in the library:
1. Data Collection: provides asynchronous data collection services for Azure ML online scoring (MOE, AKS), Azure ML batch scoring and Spark. Data is ingested into an Azure Data Explorer (ADX).
2. Monitoring: query and visualize collected metrics and data from model scoring, data preparation and model training. The ADX backend provides powerful query and analysis service for the data.
3. Drift Analysis: Provides ad-hoc and scheduled drift analysis service between a base dataset and a target dataset.
4. Management: provision required Azure resources
2. Solution architecture
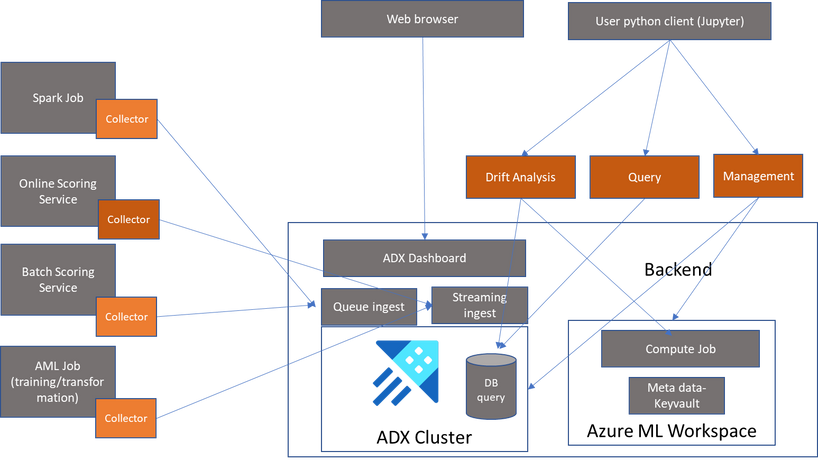
The solution provides APIs for data collection, data query, monitoring and visualization and drift analysis.
Data collection APIs can be used in any python environment. The streaming collection API can be used within a real time ML scoring service or a training job to asynchronously collect any data and metrics which are then are available immediately for querying and monitoring. The batch collection API is used to schedule collection of large data object which is normally used in a batch scoring job. The Spark collection API can be used in Databricks and Synapse Spark environment to schedule large scale Spark Data Frame. All the collection APIs are designed to run in asynchronous mode to minimize overhead to the scoring service.
The backend of the solution is an ADX cluster where data and metrics are stored. The solution utilizes many powerful timeseries and query capabilities of ADX. This also provides transparency and customizability for users to build custom dashboard and run custom analytic queries on collected data.
The solution uses Azure ML's default key vault for storing ADX credentials by default, but users can completely setup and use their own ADX cluster. It also uses Azure ML's job compute to run scheduled drift detection job.
To visualize and query data and output from detection job, users can use the Python APIs, especially the Drift Analysis ad-hoc module is built on top of Dash providing interactive analysis capability, or they can use ADX's dashboard and query studio.
3. Using the solution
3.1 Setting up
Install the Python libraries.
To install the Data Collector to ingest data:
pip install --upgrade git+https://github.com/microsoft/AzureML-Observability#subdirectory=aml-obs-collector
For client library for query, job scheduling and drift analysis
pip install --upgrade git+https://github.com/microsoft/AzureML-Observability#subdirectory=aml-obs-client
pip install azure-ai-ml==0.0.62653692 --extra-index-url https://azuremlsdktestpypi.azureedge.net/sdk-cli-v2
#Provision with default SKU of Standard_D11_v2, Standard Tier of ADX cluster. The process will also create a service principal.
#You need to have right to provision service principal in the subscription.
provision(ws)
The provision API provides customization option such as specifying a different SKU and number of nodes for ADX, ability to bring your own service principal and ADX cluster. Checkout the library documentation for detail.
3.2 Data collection
Once the resources are available, data can be ingested into Azure Data Explorer. Both training data and scoring data can be logged into ADX. There are a few methods of ingestion that can be used at the time of training and scoring including:
- Batch (batch_collect): entire pandas dataframe will be scheduled to load into ADX. Data is available for query after a few minutes.
- Stream (stream_collect_df_queue): ingest data asynchronously with an internal buffering mechanism to lower impact to main scoring thread
- Spark (spark_collect): for spark dataframes in Databricks or Synapse
Here is an example of how batch_collect can be used to log in training data:
First, let's load in the raw data and add a timestamp column.
from obs.collector import Online_Collector
import pandas as pd
dataset = pd.read_csv("https://azuremlexamples.blob.core.windows.net/datasets/iris.csv")

# Add timestamp column
dataset["timestamp"] =  [pd.to_datetime('now') - timedelta(days=x) for x in range(len(dataset))]
Now that we have the pandas dataframe, we can log it to ADX with the following:
table_name = "IRIS_DATA" #new dataset

online_collector = Online_Collector(table_name,ws=ws)
online_collector.batch_collect(dataset)
Shortly after this run, the data will be avaible in ADX for querying and monitoring.
Note: to utilize the dashboards, data must have a timestamp column.
For real time streaming logging in an online scoring service such as in managed online endpoint or AKS, uses the stream collect API. Here is an example
import os
import logging
import json
import joblib
from azureml.core.authentication import ServicePrincipalAuthentication
from azureml.core import Workspace
from obs.collector import Online_Collector
import datetime
import pandas as pd
from sklearn.preprocessing import LabelEncoder

def init():
    """
    This function is called when the container is initialized/started, typically after create/update of the deployment.
    You can write the logic here to perform init operations like caching the model in memory
    """
    global model,collector, encoder
    # AZUREML_MODEL_DIR is an environment variable created during deployment.
    # It is the path to the model folder (./azureml-models/$MODEL_NAME/$VERSION)
    labels = ['setosa', 'versicolor', 'virginica']
    encoder = LabelEncoder()
    encoder.fit(labels)
    model_path = os.path.join(
        os.getenv("AZUREML_MODEL_DIR"), "model.joblib"
    )
    # deserialize the model file back into a sklearn model
    model = joblib.load(model_path)
    table_name= os.environ.get("TABLE_NAME")
    tenant_id =os.environ.get("TENANT_ID")
    subscription_id = os.environ.get("SUBSCRIPTION_ID")
    client_secret = os.environ.get("SP_SECRET")
    client_id = os.environ.get("SP_ID")
    ws_name = os.environ.get("WS_NAME")
    rg = os.environ.get("RG")

    # cluster_uri = os.environ.get("CLUSTER_URI")
    # database_name = os.environ.get("DATABASE_NAME")
    sp = ServicePrincipalAuthentication(tenant_id=tenant_id, # tenantID
                                    service_principal_id=client_id, # clientId
                                    service_principal_password=client_secret) # clientSecret

    ws = Workspace.get(name=ws_name,
                   auth=sp,
                   subscription_id=subscription_id,
                   resource_group=rg)
    collector = Online_Collector(table_name,ws)
    collector.start_logging_daemon(buffer_time=2, batch_size=10)
    logging.info("Init complete")


def run(raw_data):
    """
    This function is called for every invocation of the endpoint to perform the actual scoring/prediction.
    In the example we extract the data from the json input and call the scikit-learn model's predict()
    method and return the result back
    """
    ts =datetime.datetime.now()

    logging.info("model 1: request received")
    data = pd.DataFrame(json.loads(raw_data)["data"])
    predictions = model.predict(data)
    predictions= encoder.inverse_transform(predictions)
    probs = model.predict_proba(data)
    probs=probs.tolist()
    data["predictions"] =predictions
    data["probs"] =probs
    data['timestamp'] = ts
    data['scoring_service'] = "managed_online"
    logging.info("Request processed")
    collector.stream_collect_df_queue(data)
    return predictions.tolist()
Notice that at init method, the online collector object is initialized with an azure machine learning's workspace object (ws). This is needed so that the online collector can access ADX's credentials stored in ws's default key vault.
In a batch scoring endpoint or in an Azure ML job, it's simpler as the workspace object is obtained by the service behind the scence without users to provide the workspace object explicitly.
from PIL import Image
import os
import tempfile
import logging
from monitoring.data_collector import Online_Collector
from azureml.core.model import Model
import joblib
import pandas as pd
from sklearn.preprocessing import LabelEncoder
import os

def init():
    global model,collector, encoder

    labels = ['setosa', 'versicolor', 'virginica']
    encoder = LabelEncoder()
    encoder.fit(labels)
    model_path = os.path.join(
        os.getenv("AZUREML_MODEL_DIR"), "model.joblib"
    )
    model = joblib.load(model_path)


def run(mini_batch):
    print(f"run method start: {__file__}, run({mini_batch})")
    resultList = []
    table_name = os.getenv("TABLE_NAME")

    # Set up logging

    for batch in mini_batch:
        # prepare each image
        data = pd.read_parquet(batch)
        predictions = model.predict(data)
        data["prediction"] =predictions

        resultList.append(data)
    result = pd.concat(resultList).drop(['Unnamed: 0'], axis=1)
    online_collector = Online_Collector(table_name)
    online_collector.batch_collect(result)
    return result
To collect data from a Spark dataframe:
data =spark.read.format("csv").option("header", True).load("wasbs://ojsales-simulatedcontainer@azureopendatastorage.blob.core.windows.net/oj_sales_data/Store10*.csv")
from obs.collector import spark_collect
table_name = "adb_oj_sales"
spark_collect(data,table_name,ws)
3.3 Monitoring
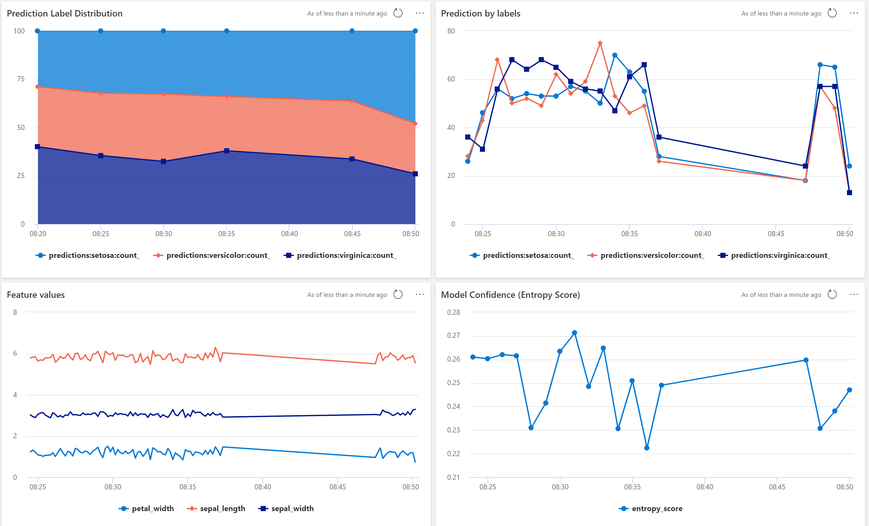
Once a model is deployed with the collector object in the score file, any scores generated when the deployment is called will be logged into the ADX table. After data is collected, the template dashboard can be imported into ADX to monitor metrics of the model in real time. This dashboard shows the distribution and count of the labels predicted, the confidence of those predictions, and the feature values over time.
The github repo provides a deployment util and a template ADX json template to reproduce this monitoring application. Check out the quick start notebooks for detail.
Other than monitoring from ADX dashboard, an interesting feature is to collect multi-dimention metrics from any python process, such as in training into an ADX table and monitor them in real time. This is useful in ML training analysis where you need to correlate and compare metrics from settings such as hyper parameters, jobs, algorithms...
The below code simulate a process of logging metrics with different learning rate (rl). This logic can be put inside a training job.
# Ingest streaming data  asynchronously with internal buffering mechanism to lower impact to main scoring thread
streaming_table_name="streaming_test"
streaming_collector = Online_Collector(streaming_table_name,ws=ws)

import random
streaming_collector.start_logging_daemon(buffer_time=2, batch_size=10)

for run_id in ["r000001", "r000002", "r000003", "r000004", "r000005"]:
    for i in range(200):
        for lr in ["0.001", "0.002"]:
            df = pd.DataFrame({ "timestamp":pd.to_datetime('now'), "lr":[lr],"metric1":[random.uniform(3,50)] })
            streaming_collector.stream_collect_df_queue(df)
Then in a seperate notebook, you can run the below code to visualize metrics with data in real time
from plotly.subplots import make_subplots
streaming_table_name="streaming_test"
rt_viz =RT_Visualization(streaming_table_name,ws)
rt_viz.scatter(max_records=200, ago='15m',groupby='lr', y_metric='metric1',x_metric='timestamp')
For complete instructions including running in notebook visualizations, review this notebook.
3.4 Drift Analysis and Monitoring
Data Drift is the variation in the production data from the data that was used to train model before deploying it in production.
Before data drift can be used, both the base dataset (normally training data) and target (production data) need to be captured into ADX with collector APIs. You can also perform arbitrary drift analysis between two datasets which can be from two seperate datasets ADX tables or from different time periods in the same table.
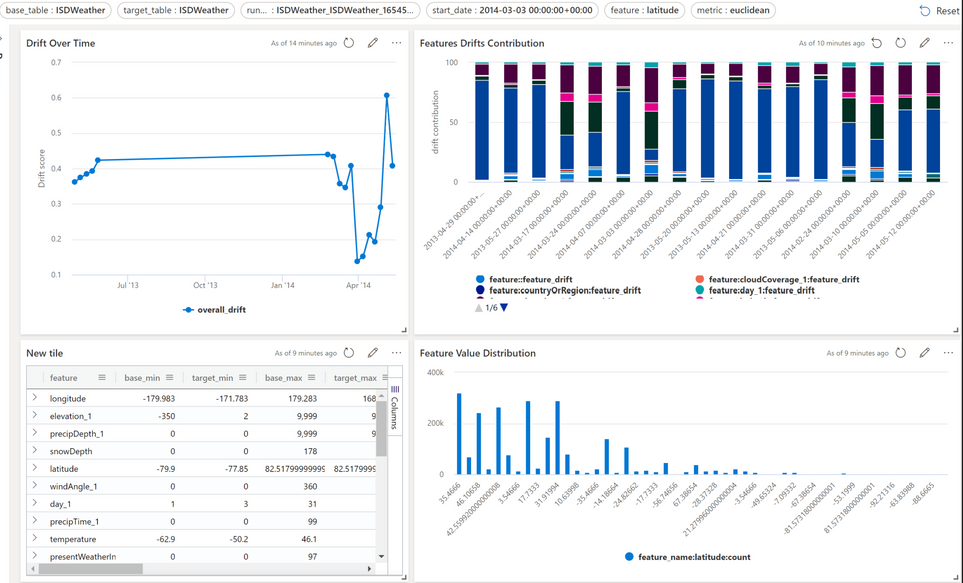
Built-in algorithms: To calculate drift for every feature, we use Wassertstein (earth-mover) distance for numerical feature and Euclidean distance for categorical feature (after encoding). See this article explains very well these concepts. In addition, we calculate other metrics such as Min, Max, Mean for numerical feature and Distinct Count for cetegorical feature so that users can have more context into the data. To arrive at the overall drift magnitude for the dataset, Wassertstein and Euclidean distances are scaled to (0,1) in each feature and average out for the entire dataset. This gives an intuition of the changes in the drift magnitude of the entire dataset over time.
User defined algorithm: users can plug in their own algorithm to calculate drift if they are not satisfied with the built-in algorithm.
How to use:The library provides several tools to help with this process. The ad-hoc python client library provides the ability to interactively perform drift analysis on any dataset from ADX. Due to the nature of interactivity, the limit is applied to select only first 10M rows so that the wait time is not too long. For larger dataset, a job scheduled drift calculation should be used.
1. Ad-hoc interactive drift analysis
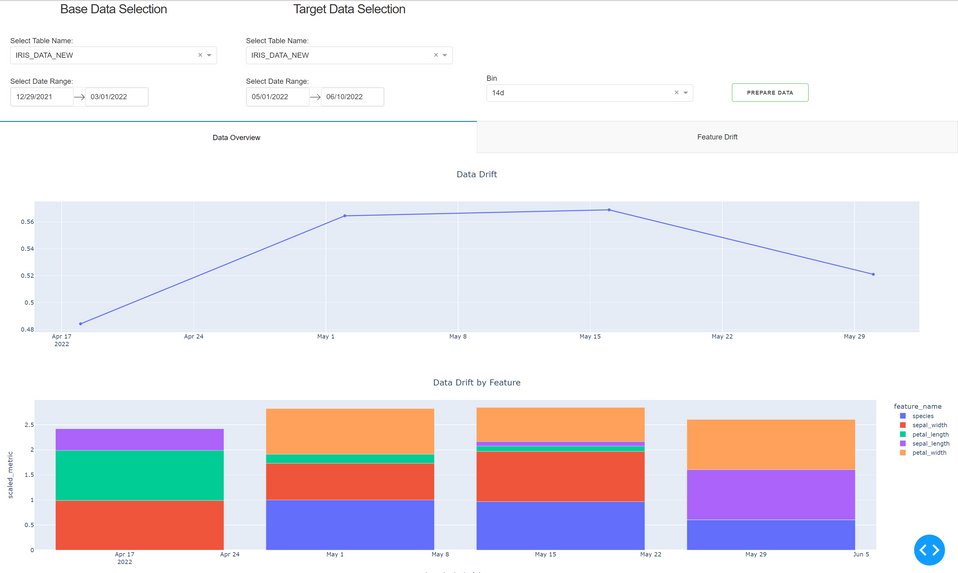
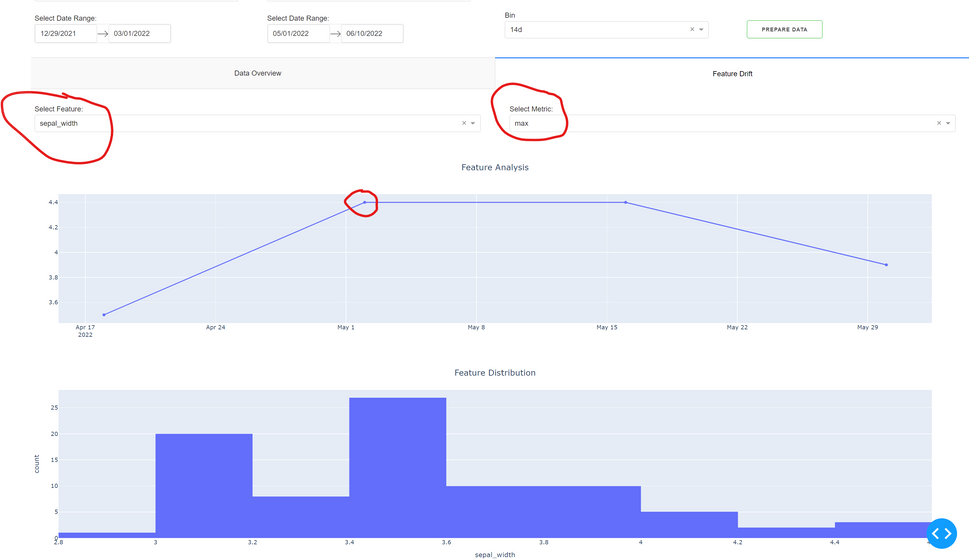
Select base dataset and target dataset, the bin (unit of time for drift calculation) and click on prepare data
The diagrams gives the magnitude of drift between base and target dataset over time and by bin. It also show the contribution of drift by individual feature.
User can go to Feature Analysis tab and select feature, metric and a period in the overall drift diagram to understand value distribution of an individual feature.
2. The library also provides the capability to schedule an Azure ML job to regularly compute drift and log the calculations into ADX. To launch the job, follow this example:
from obs.drift.drift_analysis_scheduler import execute
from datetime import datetime
from azure.ai.ml.constants import TimeZone
from dateutil import tz

from azure.ai.ml.entities import (
    CronSchedule,

    ScheduleStatus,
)
subscription_id= ""
resource_group = ""
workspace = ""
compute_name = ""
base_table_name = "IRIS_DATA_"
target_table_name = base_table_name
base_dt_from = "12/15/2021"
base_dt_to = "03/01/2022"
target_dt_from = "04/01/2022"
target_dt_to ="05/13/2022"

schedule_start_time = datetime.now(tz=tz.gettz("PACIFIC STANDARD TIME"))
cron_schedule = CronSchedule(
    expression="*/10 * * * *",
    start_time=schedule_start_time,
    time_zone=TimeZone.PACIFIC_STANDARD_TIME,
    status=ScheduleStatus.ENABLED,
)

ml_client, job_name = execute(subscription_id=subscription_id,resource_group=resource_group,workspace=workspace, compute_name =compute_name,
base_table_name =base_table_name,target_table_name =target_table_name, base_dt_from =base_dt_from, base_dt_to= base_dt_to,target_dt_from=target_dt_from,
target_dt_to=target_dt_to, bin="7d", limit=100000, concurrent_run=False, drift_threshold =0.4)
Once the dashboard is configured, use the parameters shown at the top to select the run and table to visualize the results.
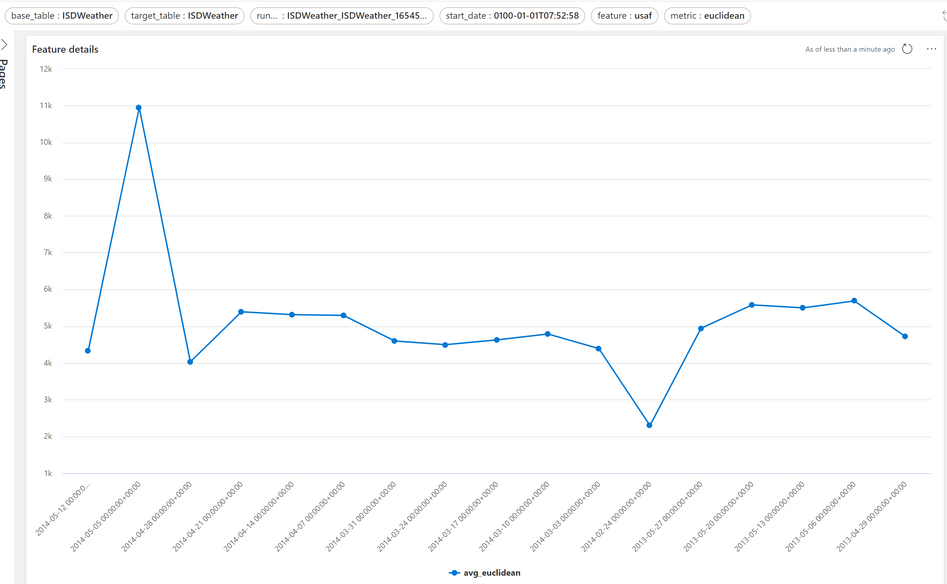
Check the feature_detail page in the same dashboard to view a feature's metric distribution
Note: if you need to provide your own data drift logic, please supply the module and check the example of user defined modules in aml-obs-client/obs/test/drift_job.
4. Quick start notebooks
For more detail, please checkout quick start notebooks
1. Provisioning: AzureML-Observability/0_provision.ipynb at main · microsoft/AzureML-Observability (github.com)
2. Monitoring: AzureML-Observability/1_monitoring.ipynb at main · microsoft/AzureML-Observability (github.com)
3. Drift: AzureML-Observability/2_drift.ipynb at main · microsoft/AzureML-Observability (github.com)
Your feedback is welcome. Issues can be logged to our repo.
You must be a registered user to add a comment. If you've already registered, sign in. Otherwise, register and sign in.
