Turn on suggestions
Auto-suggest helps you quickly narrow down your search results by suggesting possible matches as you type.
- Home
- Microsoft 365
- Modern Work App Consult Blog
- Desktop Bridge – Is your application a resource “hog”? (CPU post)
Desktop Bridge – Is your application a resource “hog”? (CPU post)
- Subscribe to RSS Feed
- Mark as New
- Mark as Read
- Bookmark
- Subscribe
- Printer Friendly Page
- Report Inappropriate Content
Published
Jan 15 2019 02:17 PM
509
Views
Jan 15 2019
02:17 PM
Jan 15 2019
02:17 PM
First published on MSDN on Sep 07, 2017
In this blog series, I hope to show you how to use a few simple tools – available in Windows 10 – to determine your application’s effect on battery life, available RAM, and average CPU consumption.
The Desktop Bridge packaging tool does not affect application performance. A packaged application executes the same binaries as the original Win32 application. Thus, a packaged application will not execute any more or less efficiently than the Win32 version. That being said it is always a good idea to know how your application will impact the overall performance of the devices running your application. Knowing things like how your application effects on battery life, available RAM, and overall CPU consumption helps guide design and code decisions around your application.
In this - the first - post, I want to start by considering two tools all versions of Windows 10 have. The first is “Task Manager” (TM) and the second is “Performance Monitor” (PM). The steps out lined below will show you how to leverage these two tool to ensure your application is not a CPU resource “hog”.
Last point
The last thing I want to show you in this post is what a CPU “hog” looks like. To do this the CPU intensive operations will be executed concurrently with a CPU “hog”. When just the CPU "hog" is executed you can see that the overall CPU utilization (from TM) is at 100% (a) and that the application CPU consumption is maxed at 382% (b).

To see how this was coded review the code listed at the end of this post. Start with the “I” case in the switch statement within the main function.
The PM results from a single application CPU test and a CPU test run concurrent with the CPU “hog” execution are shown below.

Note three basic things about the curves above.
1. The CPU test (red) took twice as long when run concurrent.
2. The CPU test process “% Time Processor” did not exceed 100% during the concurrent test.
3. The CPU “hog” maxed out at 354% not 382% when run concurrent.
What happened here is that the system did not have much available CPU to handle both applications. Thus, the test application process had to wait for processor time which explains why the execution took twice as log. Also, neither process was able to max. the CPU. Thus, both processes experienced CPU throttling by the OS. However, do note that the CPU “hog” process still managed to “hog” most of the CPU time. This is due to how the code was written. All 100 threads created here had a normal priority and contained tight nested loops. Which is why operation like this should be performed in the background.
Appendix A: Console App Code
using System;
using System.Collections.Generic;
using System.Diagnostics;
using System.IO;
using System.Linq;
using System.Reflection;
using System.Text;
using System.Threading;
using System.Threading.Tasks;
namespace Hog.app
{
class Program
{
private class PerfData
{
public string LineText { get; set; }
public long ElapsedMilliseconds { get; set; }
}
static List _lines = new List();
static bool _terminate = false;
static void Main(string[] args)
{
while(!_terminate)
{
char ch = Console.ReadKey().KeyChar;
switch (ch)
{
case 's':
SaveRun();
break;
case 'x':
_terminate = true;
SaveRun();
break;
case 'c':
ch = '0';
ConsumeCPU();
break;
case 'i':
ch = '0';
Task.Run(() =>
{
while (true)
{
ConsumeCPU();
}
});
break;
case 'v':
ch = '0';
SingleRun();
break;
}
}
}
private static void SingleRun()
{
Stopwatch Clock = new Stopwatch();
StartTimer(Clock, Thread.CurrentThread.ManagedThreadId);
Console.WriteLine("Start: Single CPU Burn");
for (int r = 0; r < 10; r++) { Task.Run(() =>
{
for (int i = 0; i < 1000; i++)
{
for (int ii = 0; ii < 10000; ii++)
{
string x = "xxxx";
if (x == String.Empty)
{
x = "xxxx";
}
}
}
});
}
EndTimer(Clock, Thread.CurrentThread.ManagedThreadId);
}
private static void SaveRun()
{
long TotalTime = 0;
using (System.IO.StreamWriter file = new System.IO.StreamWriter(GenFileName()))
{
if (_lines.Count == 0)
{
file.WriteLine("No Data");
}
else
{
foreach (PerfData line in _lines)
{
file.WriteLine(line.LineText);
TotalTime += line.ElapsedMilliseconds;
}
file.WriteLine("---------------------------------------");
file.WriteLine(string.Format("Average Time: {0:0.0000} ms", TotalTime / _lines.Count));
}
}
}
private static string GenFileName()
{
return String.Format(@"{0}\TestRun-{1:dd-MM-yyyy_hh-mm-ss}.txt", AppDomain.CurrentDomain.BaseDirectory, DateTime.Now);
}
private static void ConsumeCPU()
{
Console.WriteLine("Start: CPU Burn");
for (int ThreadCount = 0; ThreadCount < 100; ThreadCount++) { Task.Run(() =>
{
Stopwatch Clock = new Stopwatch();
StartTimer(Clock, Thread.CurrentThread.ManagedThreadId);
for (int i = 0; i < 1000; i++)
{
for (int ii = 0; ii < 10000; ii++)
{
string x = "xxxx";
if (x == String.Empty)
{
x = "xxxx";
}
}
}
EndTimer(Clock, Thread.CurrentThread.ManagedThreadId);
});
}
}
private static void EndTimer(Stopwatch Clock, int CurrentThread)
{
Clock.Stop();
Console.WriteLine(string.Format("Thread {0} - End Time: {1:h:mm:ss tt} / Time Elasped: {2} ms", CurrentThread, DateTime.Now, Clock.ElapsedMilliseconds));
if (!_terminate)
_lines.Add(new PerfData()
{
LineText = string.Format("Thread {0} - End Time: {1:h:mm:ss tt} / Time Elasped: {2} ms", CurrentThread, DateTime.Now, Clock.ElapsedMilliseconds),
ElapsedMilliseconds = Clock.ElapsedMilliseconds
});
Clock.Reset();
}
private static void StartTimer(Stopwatch Clock, int CurrentThread)
{
Clock.Start();
Console.WriteLine(string.Format("Thread {0} - Start Time: {1:h:mm:ss tt}", CurrentThread, DateTime.Now));
}
}
}
In this blog series, I hope to show you how to use a few simple tools – available in Windows 10 – to determine your application’s effect on battery life, available RAM, and average CPU consumption.
The Desktop Bridge packaging tool does not affect application performance. A packaged application executes the same binaries as the original Win32 application. Thus, a packaged application will not execute any more or less efficiently than the Win32 version. That being said it is always a good idea to know how your application will impact the overall performance of the devices running your application. Knowing things like how your application effects on battery life, available RAM, and overall CPU consumption helps guide design and code decisions around your application.
In this - the first - post, I want to start by considering two tools all versions of Windows 10 have. The first is “Task Manager” (TM) and the second is “Performance Monitor” (PM). The steps out lined below will show you how to leverage these two tool to ensure your application is not a CPU resource “hog”.
- Install your application via the “App Installer” on a clean machine or VM. Sebastien Bovo has provided us with a great script to sign the appx file (see https://blogs.msdn.microsoft.com/appconsult/2017/08/07/unpack-modify-repack-sign-appx/ ) for side load installation.
- Launch the application from the Windows Menu.
-
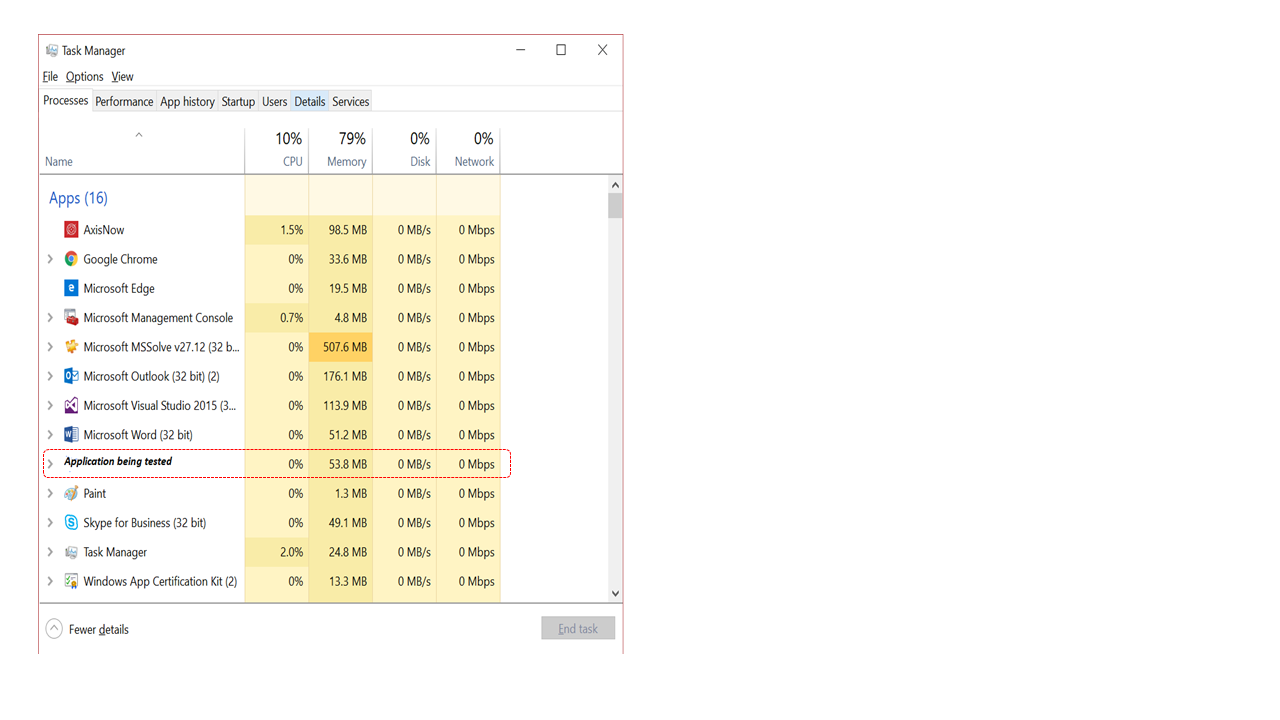
Open “Task Manager” and identify all process associated to your application. For example, if your app is contained in a single executable file you will see that file name listed in Task Manager under the “Apps” grouping within the “Processes” tab as shown below.
If your application launches background processes, these will be listed under the “Background processes” grouping which can be found under “Apps” grouping.
-
Open “Performance Monitor” on your Windows 10 desktop.
Windows Start -> Computer Management -
Expand Performance and Monitoring tools. Next select “Performance Monitor”.
-
Use the indicated “+” to add the two counters listed below. Both counters can be found in the “Process” counter group (see above). After selecting counter select the process instance to monitor below and click the add button to add the counter.
a. % Processor Time – This is the percentage of elapsed time that all of process threads used the processor to execution instructions.
b. Private Bytes – This is the current size, in bytes, of memory that this process has allocated that cannot be shared with other processes.
-
Once both counters are added click "OK". The two counters will appear at the bottom of the graph as shown below.
- Ensure that you have the correct process selected in PM by passing the mouse over the application window and checking the CPU counter curve for some slight activity as indicated above.
-
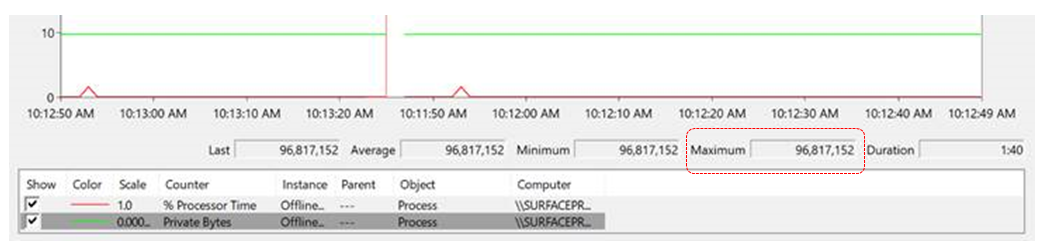
If the Private Bytes counter graph is stuck at or near 100% you will need to re-scale that counter. To do this follow the steps below.
a. A counter will show the values for said counter when it is selected (see above). The max. number (indicated above) can be used to figure out the scale needed to graph the counter curve.b. To change the scale, right click on the counter selected and open the “Properties” window. Select a new scale which places the counter curve near 10% as shown above. Tip - To quickly find the correct scale just count the number of digits in the max. value and match that to the number of digits in the scale number. -
Execute a taxing use case. Here the counters should indicate some action.
Note the bump in memory in green and the CPU spike – defined by any CPU gain over 20% - in red. Just eye ball the width of the spike by measuring the width at ~50% of the spike height. Here it would appear that the spike has a one second mid-point width. This is fine and will have no noticeable effect on the device performance. If, this spike was over 5 seconds (mid-point width) then the end user would notice a slight performance degradation. -
Below is an example of a more stressful operation within the same application. Try to identify a similar operation in your application. Make a note of the use case and ensure that the counter graph looks similar for each run as shown below.
Here the “% Processor Time” performance counter (red) shows a significant spike with a mid-point width of between 10 and 12 seconds. -
At this point we need to get an understanding of how this CPU intensive operation is impacting the device and other applications running on the device. The ideal tool for this is the “Window Performance Analyzer” and in a future post I will be explaining how to use this tool. However, in this post I want to stay focused on the Performance Monitor and Task Manager tools.
To get an understanding of how a CPU intensive operation is impacting the device we need to use the Task Manager. Follow the steps illustrated below on your application.a. If “Task Manager” is not open, open it and select the “Performance” tab as shown below.
b. Select CPU on the left side and note the overall CPU utilization. Take your hand off the mouse and wait for the device to enter an idle state (see above). This is your CPU utilization base line. All test of your CPU intensive operation need to be made when the CPU utilization is within the established base line.c. Make sure that you can see both Performance Monitor (PM) and Task Manager (TM) at the same time. Once you have your screen arranged, execute the CPU intensive operation. You might notice a different CPU utilization number between PM and TM. This is due to how each tool calculates CPU utilization. PM dose not distinguish between logical processors (or cores) whereas TM does. Thus, for example PM - on a machine with 4 logical processors - would see a possible CPU utilization of 400% and TM would normalize the overall to a possible max. of 100%.Also, in TM if you want to see how each processor is sharing the load right click on the CPU graph and select “Logical Processors” as shown below.
Here we can see that the application CPU consumption maxed out at 112% while the overall device CPU consumption reached ~50%.d. Sometimes CPU intensive operations have a significant memory utilization number as well. To test for this, select the memory option on the left side of TM and repeat the test. The results shown below illustrate that this operation does not affect RAM consumption significantly. The “Private Bytes” performance counter measured in PM also shows only a slight fluctuation in memory consumed. -
With the completion of step 12 we know that this CPU intensive operations does impact the overall performance of the system. Now we want to get an idea of how this application would impact other running application. There is no single ideal way to do this. The method illustrated below is just one (rather low tech) method.Follow the steps below to try this method out.a. Take the code at the bottom of this post and build a .NET console application.b. Execute a single instance the console application and add the PM counters “% Processor Time” and “Private Bytes” to your current PM session.c. Now we want to test that PM is configured correctly and get a few baseline executions times from the console application. To do this type “v” in the console window. The output should appear as shown below.
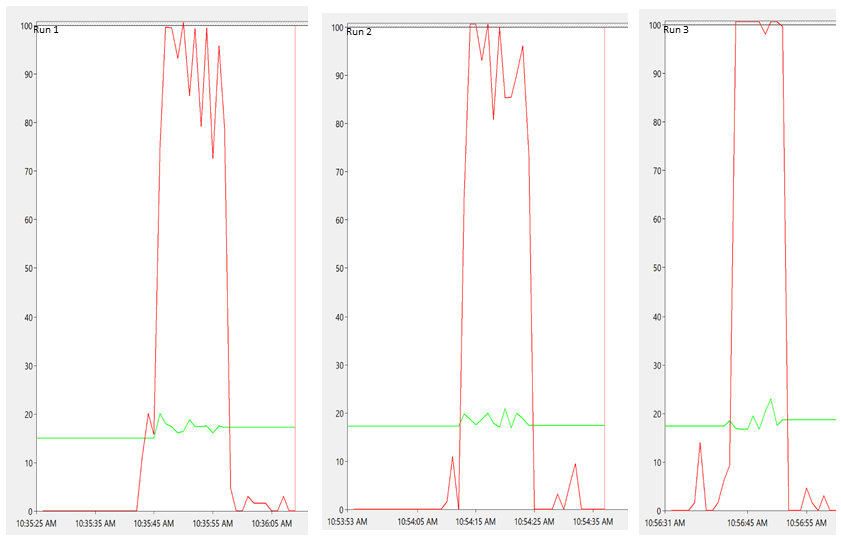
d. Run “v” on the console application a few more time to get an average execution time.e. Now run the CPU intensive operations on your application and concurrently run “v” from the console application.
The results (shown above) illustrate that the device used in my testing (Surface Pro 3 i7) can handle the load from both applications. Note that the width of the spike (red) has not significantly changed between the single execution and the concurrent execution. Also, note that the dip in CPU (red) lines up with the rise in CPU (green). This is what you want to see to ensure your application is not a CPU hog on the min. targeted application hardware.


Last point
The last thing I want to show you in this post is what a CPU “hog” looks like. To do this the CPU intensive operations will be executed concurrently with a CPU “hog”. When just the CPU "hog" is executed you can see that the overall CPU utilization (from TM) is at 100% (a) and that the application CPU consumption is maxed at 382% (b).
To see how this was coded review the code listed at the end of this post. Start with the “I” case in the switch statement within the main function.
The PM results from a single application CPU test and a CPU test run concurrent with the CPU “hog” execution are shown below.
Note three basic things about the curves above.
1. The CPU test (red) took twice as long when run concurrent.
2. The CPU test process “% Time Processor” did not exceed 100% during the concurrent test.
3. The CPU “hog” maxed out at 354% not 382% when run concurrent.
What happened here is that the system did not have much available CPU to handle both applications. Thus, the test application process had to wait for processor time which explains why the execution took twice as log. Also, neither process was able to max. the CPU. Thus, both processes experienced CPU throttling by the OS. However, do note that the CPU “hog” process still managed to “hog” most of the CPU time. This is due to how the code was written. All 100 threads created here had a normal priority and contained tight nested loops. Which is why operation like this should be performed in the background.
Appendix A: Console App Code
using System;
using System.Collections.Generic;
using System.Diagnostics;
using System.IO;
using System.Linq;
using System.Reflection;
using System.Text;
using System.Threading;
using System.Threading.Tasks;
namespace Hog.app
{
class Program
{
private class PerfData
{
public string LineText { get; set; }
public long ElapsedMilliseconds { get; set; }
}
static List _lines = new List();
static bool _terminate = false;
static void Main(string[] args)
{
while(!_terminate)
{
char ch = Console.ReadKey().KeyChar;
switch (ch)
{
case 's':
SaveRun();
break;
case 'x':
_terminate = true;
SaveRun();
break;
case 'c':
ch = '0';
ConsumeCPU();
break;
case 'i':
ch = '0';
Task.Run(() =>
{
while (true)
{
ConsumeCPU();
}
});
break;
case 'v':
ch = '0';
SingleRun();
break;
}
}
}
private static void SingleRun()
{
Stopwatch Clock = new Stopwatch();
StartTimer(Clock, Thread.CurrentThread.ManagedThreadId);
Console.WriteLine("Start: Single CPU Burn");
for (int r = 0; r < 10; r++) { Task.Run(() =>
{
for (int i = 0; i < 1000; i++)
{
for (int ii = 0; ii < 10000; ii++)
{
string x = "xxxx";
if (x == String.Empty)
{
x = "xxxx";
}
}
}
});
}
EndTimer(Clock, Thread.CurrentThread.ManagedThreadId);
}
private static void SaveRun()
{
long TotalTime = 0;
using (System.IO.StreamWriter file = new System.IO.StreamWriter(GenFileName()))
{
if (_lines.Count == 0)
{
file.WriteLine("No Data");
}
else
{
foreach (PerfData line in _lines)
{
file.WriteLine(line.LineText);
TotalTime += line.ElapsedMilliseconds;
}
file.WriteLine("---------------------------------------");
file.WriteLine(string.Format("Average Time: {0:0.0000} ms", TotalTime / _lines.Count));
}
}
}
private static string GenFileName()
{
return String.Format(@"{0}\TestRun-{1:dd-MM-yyyy_hh-mm-ss}.txt", AppDomain.CurrentDomain.BaseDirectory, DateTime.Now);
}
private static void ConsumeCPU()
{
Console.WriteLine("Start: CPU Burn");
for (int ThreadCount = 0; ThreadCount < 100; ThreadCount++) { Task.Run(() =>
{
Stopwatch Clock = new Stopwatch();
StartTimer(Clock, Thread.CurrentThread.ManagedThreadId);
for (int i = 0; i < 1000; i++)
{
for (int ii = 0; ii < 10000; ii++)
{
string x = "xxxx";
if (x == String.Empty)
{
x = "xxxx";
}
}
}
EndTimer(Clock, Thread.CurrentThread.ManagedThreadId);
});
}
}
private static void EndTimer(Stopwatch Clock, int CurrentThread)
{
Clock.Stop();
Console.WriteLine(string.Format("Thread {0} - End Time: {1:h:mm:ss tt} / Time Elasped: {2} ms", CurrentThread, DateTime.Now, Clock.ElapsedMilliseconds));
if (!_terminate)
_lines.Add(new PerfData()
{
LineText = string.Format("Thread {0} - End Time: {1:h:mm:ss tt} / Time Elasped: {2} ms", CurrentThread, DateTime.Now, Clock.ElapsedMilliseconds),
ElapsedMilliseconds = Clock.ElapsedMilliseconds
});
Clock.Reset();
}
private static void StartTimer(Stopwatch Clock, int CurrentThread)
{
Clock.Start();
Console.WriteLine(string.Format("Thread {0} - Start Time: {1:h:mm:ss tt}", CurrentThread, DateTime.Now));
}
}
}
0
Likes
You must be a registered user to add a comment. If you've already registered, sign in. Otherwise, register and sign in.