- Home
- Windows
- Windows Blog Archive
- The Cases of the Blue Screens: Finding Clues in a Crash Dump and on the Web
- Subscribe to RSS Feed
- Mark as New
- Mark as Read
- Bookmark
- Subscribe
- Printer Friendly Page
- Report Inappropriate Content

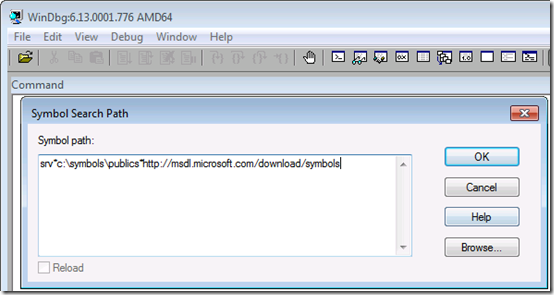
Debugging a crash starts with downloading the Debugging Tools for Windows package (part of the Windows SDK – note that you can do a web install of just the Debugging Tools instead of downloading and installing the entire SDK), installing it, and configuring it to point at the Microsoft symbol server so that the debugger can download the symbols for the kernel, which are required for it to be able to interpret the dump information. You do that by opening the symbol configuration dialog under the File menu and entering the symbol server URL along with the name of a directory on your system where you’d like the debugger to cache symbol files it downloads:

The next step is loading the crash dump into the debugger Open Crash Dump entry in the File menu. Where Windows saves dump files depends on what version of Windows you’re running and whether it’s a client or server edition. There’s a simple rule of thumb you can follow that will lead you to the dump file regardless, though, and that’s to first check for a file named Memory.dmp in the %SystemRoot% directory (typically C:\Windows); if you don’t find it, look in the %SystemRoot%\Minidumps directory and load the newest minidump file (assuming you want to debug the latest crash).
When you load a dump file into the debugger, the debugger uses heuristics to try and determine the cause of the crash. It points you at the suspect by printing a line that says “Probably caused by:" with the name of the driver, Windows component, or type of hardware issue. Here’s an example that correctly identifies the problematic driver responsible for the crash, myfault.sys:

In my talks, I also show you that clicking on the !analyze -v hyperlink will dump more information, including the kernel stack of the thread that was executing when the crash occurred. That’s often useful when the heuristics fail to pinpoint a cause, because you might see a reference to a third-party driver that, by being active around the site of the crash, might be the guilty party. Checking for a newer version of any third-party drivers displayed in this basic analysis often leads to a fix. I documented a troubleshooting case that followed this pattern in a previous blog post, The Case of the Crashed Phone Call .
When you don’t find any clues, perform a Web search with the textual description of the crash code (reported by the !analyze -v command) and any key words that describe the machine or software you think might be involved. For example, one administrator was experiencing intermittent crashes across a Citrix server farm. He didn’t realize he could even look at a crash dump file until he saw a Case of the Unexplained presentation. After returning to his office from the conference, he opened dumps from several of the affected systems. Analysis of the dumps yielded the same generic conclusion in every case, that a driver had not released kernel memory related to remote user logons (sessions) when it was supposed to:

Hoping that a Web search might offer a hint and not having anything to lose, he entered “session_has_valid_pool_on_exit and citrix” in the browser search box. To his amazement, the very first result was a Citrix Knowledge Base fix for the exact problem he was seeing, and the article even displayed the same debugger output he was seeing:

After downloading and installing the fix, the server farm was crash-free.
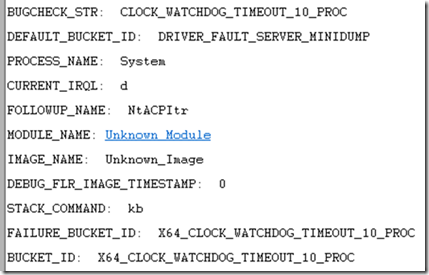
In another example, an administrator saw a server crash three times within several days. Unfortunately, the analysis didn’t point at a solution, it just seemed to say that the crash occurred because some internal watchdog timer hadn’t fired within some time limit:

Like the previous case, the administrator entered the crash text into the search engine and to his relief, the very first hit announced a fix for the problem:

The server didn’t experience any more crashes subsequent to the application of the listed hotfix.
These cases show that troubleshooting is really about finding clues that lead you to a solution or a workaround, and those clues might be obvious, require a little digging, or some creativity. In the end it doesn’t matter how or where you find the clues, so long as you find a solution to your problem.