- Home
- Windows
- Windows Blog Archive
- The Case of the Veeerrry Slow Logons
- Subscribe to RSS Feed
- Mark as New
- Mark as Read
- Bookmark
- Subscribe
- Printer Friendly Page
- Report Inappropriate Content
This case is my favorite kind of case, one where I use my own tools to solve a problem affecting me personally. The problem at the root of it is also one you might run into, especially if you travel, and demonstrates the use of some Process Monitor features that many people aren’t aware of, making it an ideal troubleshooting example to document and share.
The story unfolds the week before last when I made a trip to Orlando to speak at Microsoft’s TechEd North America conference. While I was there I began to experience five minute black-screen delays when I logged on to my laptop’s Windows 7 installation:

I’d typically chalk up an isolated delay like this to networking issues, common at conferences and with hotel WiFi, but I hit the issue consistently switching between the laptop’s Windows 8 installation, where I was doing testing and presentations, and the Windows 7 installation, where I have my development tools. Being locked out of your computer for that long is annoying to say the least.
The first time I ran into the black screen I forcibly rebooted the system after a couple of minutes because I thought it had hung, but when the delay happened a second time I was forced to wait it out and face the disappointing reality that my system was sick. When I logged off and back on again without a reboot in between, though, I didn’t hit the delay. It only occurred when logging on after a reboot, which I was doing as I switched between Windows 7 and Windows 8. What made the situation especially frustrating was that whenever I rebooted I was always in a hurry to get ready for my next presentation, so had to suffer with the inconvenience for several days before I finally had the opportunity to investigate.
Once I had a few spare moments, I launched Sysinternals Autoruns , an advanced auto-start management utility, to disable any auto-starting images that were located on network shares. I knew from previous executions of Autoruns on the laptop that Microsoft IT configures several scheduled tasks to execute batch files that reside on corporate network shares, so suspected that timeouts trying to launch them were to blame:

I logged off and logged back on with fingers crossed, but the delay was still there. Next, I tried logging into a local account to see if this was a machine-wide problem or one affecting just my profile. No delay. That was a positive sign since it meant that whatever the issue was, it would probably be relatively easy to fix once identified.
My goal now was to determine what was holding up the switch to the desktop. I had to somehow get visibility into what was going on during a logon immediately following a boot. The way that immediately jumped to mind as the easiest was to use Sysinternals Process Monitor to capture a trace of the boot process. Process Monitor, a tool that monitors system-wide file system, registry, process, DLL and network operations, has the ability to capture activity from very early in the boot, stopping its capture only when the system shuts down or you run the Process Monitor user interface. I selected the boot logging entry from the Options and opened the boot logging dialog:
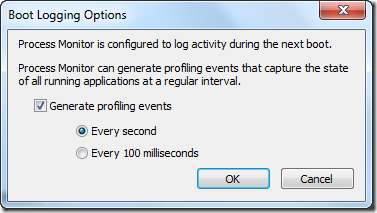
The dialog lets you direct Process Monitor to collect profiling events while it’s monitoring the boot, which are periodic samples of thread stacks. I enabled one-second profiling, hoping that even if I didn’t spot operations that explained the delay, that I could get a clue from the stacks of the threads that were active just before or during the delay.
After I rebooted, I logged on, waited for five minutes looking at a black screen, then finally got to my desktop, where I ran Process Monitor again and saved the boot log. Instead of scanning the several million events that had been captured, which would have been like looking for a needle in a haystack, I used this Process Monitor filter to look for operations that took more than one second, and hence might have caused the slow down:

Unfortunately, the filter cleared the display, dashing my hopes for quickly finding a clue.
Wondering if perhaps the sequence of processes starting during the logon might reveal something, I opened the Process Tree dialog from the Tools menu. The dialog shows the parent-child relationships of all the processes active during a capture, which in the case of a boot trace means all the processes that executed during the boot and logon process. Focusing my attention on Winlogon.exe, the interactive logon manager, I noticed that a process named Atbroker.exe launched around the time I entered my credentials, and then Userinit.exe executed at the time my desktop finally appeared:

The key to the solving the mystery lay in the long pause in between. I knew that Logonui.exe simply displays the logon user interface and that Atbroker.exe is just a helper for transitioning from the logon user interface to a user session, which ruled them out, at least initially. The black screen disappeared when Userinit.exe had started, so Userinit’s parent process, Winlogon.exe, was the remaining suspect. I set a filter to include just events from Winlogon.exe and added the Relative Time column to easily see when events occurred relative to the start of the boot. When I looked at the resulting items I could easily see the delay was actually about six minutes, but there was no activity in that time period to point me at a cause:
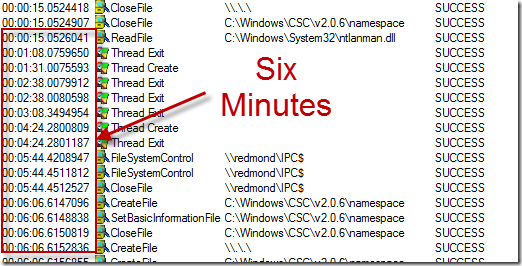
Profiling events are excluded by default, so I clicked on the profile event filter button in the toolbar to include them, hoping that they might offer some insight:

In order to minimize log file sizes, Process Monitor’s profiling only captures a thread’s stack if the thread has executed since the last time it was sampled. I therefore was expecting to have to look at the thread profile events at the start of the event, but my eye was drawn to a pattern of the same four threads sampled every second throughout the entire black-screen period:
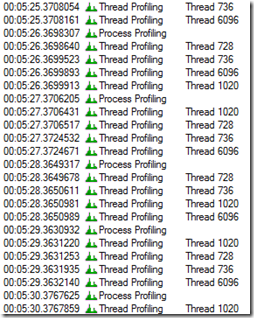
I was fairly certain that whatever thread was holding things up had executed some function at the beginning of the interval and was dormant throughout, so was skeptical that any of these active threads were related to the issue, but it was worth spending a few seconds to look at them. I opened the event properties dialog for one of the samples by double-clicking on it and switched to its Stack page, on the off chance that the names of the functions on the stack had an answer.
When I first run Process Monitor on a system I configure it to pull symbols for Windows images from the Microsoft public symbol server using the Debugging Tools for Windows debug engine DLL, so I can see descriptive function names in the stack frames of Windows executables, rather than just file offsets:

The first thread’s stack identified the thread as a core Winlogon “state machine” thread waiting for some unknown notification, yielding no clues:
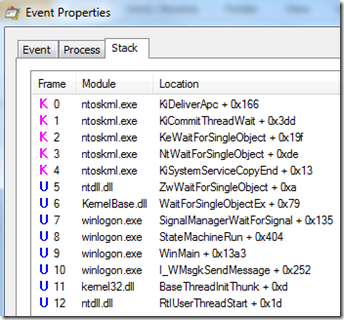
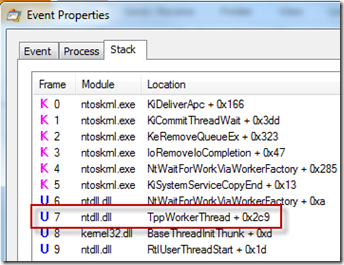
The next thread’s stack was just as unenlightening, showing the thread to be a generic worker thread:
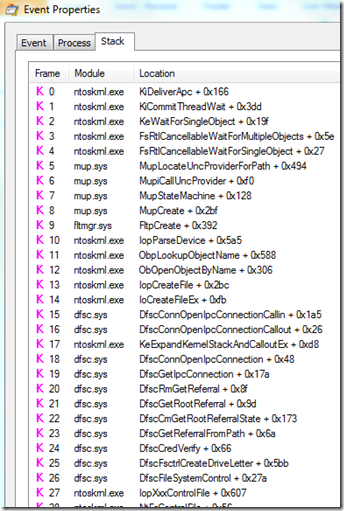
The stack of the third thread was much more interesting. It was many frames deep, including calls into functions of the Multiple UNC Provider (MUP) and Distributed File System Client (DFSC) drivers, both related to accessing file servers:
I scrolled down to see the frames higher on the stack and the name of one of the functions, WLGeneric_ActivationAndNotifyStartShell_Execute , pretty much confirmed the thread to be the one responsible for the problem, since it implied that it was supposed to start the desktop shell:
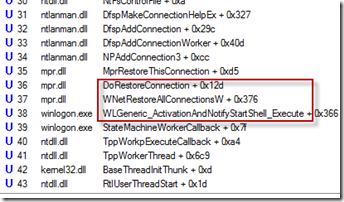
The next frame’s function, WNetRestoreAllConnectionsW , combined with the deeper calls into file server functions, led me to conclude that Winlogon was trying to restore file server drive letter mappings before proceeding to launch my shell and give me access to the desktop. I quickly opened Explorer, recalling that I had two drives mapped to network shares hosted on computers inside the Microsoft network, one to my development system and another to the internal Sysinternals share where I publish pre-release versions of the tools. While at the conference I was not on the intranet, so Winlogon was unable to reconnect them during the logon and was eventually – after many minutes – giving up:

Confident I’d solved the mystery, I right-clicked on each share and disconnected it. I rebooted the laptop to verify my fix (workaround to be precise), and to my immense satisfaction, the logon proceeded to the desktop within a few seconds. The case was closed! As for why the delays were unusually long, I haven’t had the time – or need - to investigate further. The point of this story isn’t to highlight this particular issue, but illustrate the use of the Sysinternals tools and troubleshooting techniques to solve problems.
TechEd Europe, which took place in Amsterdam last week, gave me another chance to reprise the talks I’d given at TechEd US. I delivered the same Case of the Unexplained troubleshooting session I had at TechEd US, but this time I had the pleasure of sharing this very fresh and personal case. You can watch it and my other TechEd sessions either by going to my webcasts page, which lists all of my major sessions posted online, or follow these links directly:
Windows Azure Virtual Machines and Virtual Networks
Windows Azure Internals
Malware Hunting with the Sysinternals Tools
Case of the Unexplained 2012
And you can see all of both event’s sessions online at their webcast sites:
TechEd North America 2012 On-Demand Recordings
TechEd Europe 2012 On-Demand Recordings
I hope you enjoyed this case!