First published on MSDN on Oct, 13 2009
In Visio 2007, we introduced the data graphics feature to make it possible to display data on shapes using text callouts, data bars, or icons, or by coloring the shapes based on the data. As the data changes, the data graphics update accordingly.
With data graphics, Visio diagrams can be used to visualize dynamic data in powerful and succinct ways. For example, data graphics are used on these network server shapes to show their network name, operating system, and IP address as text callouts that appear next to them. Data bars show CPU speed and memory, and an icon is used to indicate each server’s current status. The data associated with each shape can be conveyed at a glance.

In Visio 2010, we’ve given the data graphics feature a makeover to integrate it into the ribbon and to address feedback we heard from users. We also added a legend feature, but we’ll talk about that in an upcoming post.
As in Visio 2007, before you can display data using a data graphic, you first need to have some data in your shapes. You can add the data manually in the Shape Data Window for each shape, or you can import the data into the diagram from an external data source like an Excel worksheet or a SQL database, using the Link Data to Shapes button on the Data tab. The data will appear in the External Data Window.

Once you drag a row of data from the External Data Window onto a shape to establish the link to the shape, a set of data graphics is created in the Data Graphics gallery, which replaces the task pane used in Visio 2007. The first data graphic in the gallery is automatically applied to the data-linked shape.

You can also create a new data graphic or edit one of the data graphics that Visio built for you in the gallery.
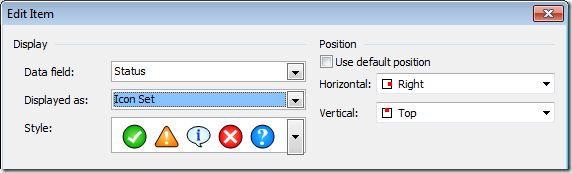
In addition to integrating the user interface into the ribbon, we made some improvements to the dialog boxes based on user feedback. First, if you want to change the way a data field is displayed in the data graphic, you no longer have to delete the data field item and add a new one. For example, if you want to make an item display as an icon instead of a text callout, you can simply edit the item…

…and switch its display type from Text…

…to Icon Set.
When you edit a data graphic, we now give you a choice between applying the changes to all shapes with that data graphic applied (the only option in Visio 2007) or only to the selected shapes, using radio buttons at the bottom of the Edit Data Graphic dialog box. The latter choice makes a copy of the data graphic and applies it to the selected shapes.

Visio 2007 users asked us for more control over the formatting of text and other elements in data graphics. In Visio 2010, you can choose the font size used for the value and label in a text callout or data bar, and you can specify the width of the callout.

Please check out the new Data Graphics user interface and let us know what you think, either by commenting on the blog or (if you’re using the Visio 2010 Technical Preview) via Send a Smile .


