- Home
- System Center
- System Center Blog
- Stepping through Custom Activity Code using the Debugger
- Subscribe to RSS Feed
- Mark as New
- Mark as Read
- Bookmark
- Subscribe
- Printer Friendly Page
- Report Inappropriate Content
One of the first questions people have when they start writing custom Orchestrator activities using the SDK is “How do I step through my code?”. After all, activities are not executables, they’re just classes. And, it’s not until the classes are packaged with the Orchestrator Integration Pack Wizard that they truly become activities usable in a runbook. Since there’s no way to launch the Runbook Tester in context with an activity, just how do you debug your code? Well, it’s actually very simple. In this example, I have Orchestrator installed on my dev machine so I don’t have to do remote debugging, and it also ensures that all my changes are isolated from any other Orchestrator installation.
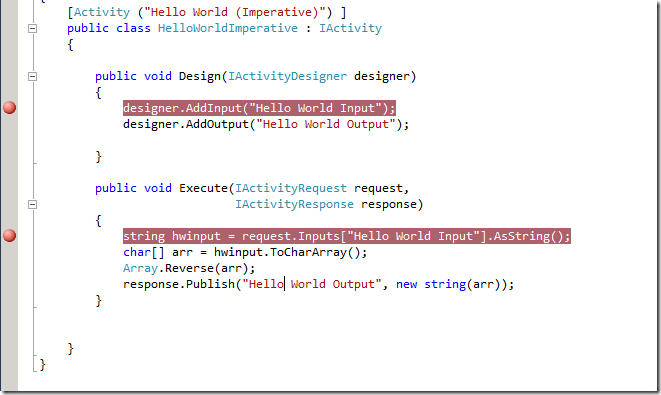
Let’s use the “Hello World” activity in the Orchestrator SDK Examples ( http://orchestrator.codeplex.com ). When I compile the example code, I get an assembly that I can use with the Invoke .NET activity (which comes in the Integration Pack inside the Orchestrator Integration Toolkit). By the way, you should always iterate through your development process using Invoke .NET as a wrapper on your custom activity at first rather than creating an IP for every iteration. The overhead associated with that is a bit much for early in the process. You only need to create an IP when you need to test the packaging and deployment mechanism or when you have complex installation dependencies. Of course, you’ll also need to compile the code in debug mode.
First, set a couple of breakpoints in the code to ensure execution will stop for you.
Next, I need to create a runbook that I can use to test out my code. I’ll put in this runbook an Initialize Data activity and an Invoke .NET activity.

Then, I set the assembly and the class name to use inside the Invoke .NET activity like this:

Next, start the Runbook Tester for this runbook by clicking the toolbar icon. When the Runbook Tester opens, click Step Through . This starts the runbook but doesn’t actually let it continue running. This starts the PolicyModule.exe process, which you can now attach to for debugging.
Switch over to Visual Studio and click Debug > Attach to Process . Make sure that the Attach to field says “Managed (v2.0, v1.1, v1.0) code”. If it doesn’t, click the Select button and select that value. Now look through the process list and select PolicyModule.exe . If you don’t see it, make sure the checkbox for “Show processes in all sessions” is checked. If multiple PolicyModule.exe processes exist, your dev machine is also an active Runbook Server and you’ll have to figure out which one to attach to, usually by looking at the list, starting the runbook and seeing which new PolicyModule.exe process started.
Then, go back to the Runbook Tester and click Run . You’ll see the breakpoint icons change to show you the code is loaded but the symbols aren’t, and then the symbols load and the code stops at the breakpoint under the Execute method.

So why didn’t the breakpoint in the Design method get used? It’s because the Design method is used only at design time, when the Runbook Designer is being used to create the runbook. Luckily, you can step through the debugger on that too. Just start the Runbook Designer, then go to Visual Studio and click Debug > Attach to Process , and this time select RunbookDesigner.exe . Then, go back to the Runbook Designer, open your runbook created above, open the Invoke .NET activity and click on the Properties tab. Visual Studio should load the assembly and stop at your breakpoint!

Of course, with the debugger, you get to see how inputs, filters and outputs are being handled within Orchestrator by inspecting values of your objects.

Using these two quick processes, you can step through both the design time and runtime portions of your custom activity and speed your development times over guessing, logging, and other trial and error methods.
Happy coding!
You must be a registered user to add a comment. If you've already registered, sign in. Otherwise, register and sign in.