- Home
- System Center
- System Center Blog
- Operations Manager 2012 Dashboards – The Alert Widget
- Subscribe to RSS Feed
- Mark as New
- Mark as Read
- Bookmark
- Subscribe
- Printer Friendly Page
- Report Inappropriate Content
In a previous post , my co-worker Chris showed off our new Performance Widget and detailed how to configure it. Continuing with our series of post on Dashboards and Widgets in System Center Operations Manager 2012, today I plan on focusing on configuring the new Alert Widget .
(Like the last performance widget post, this post assumes that you have already created a dashboard using the instructions in the Dashboards post , and that you have at least one cell that does not yet have a widget.)
Adding an alert widget to a dashboard
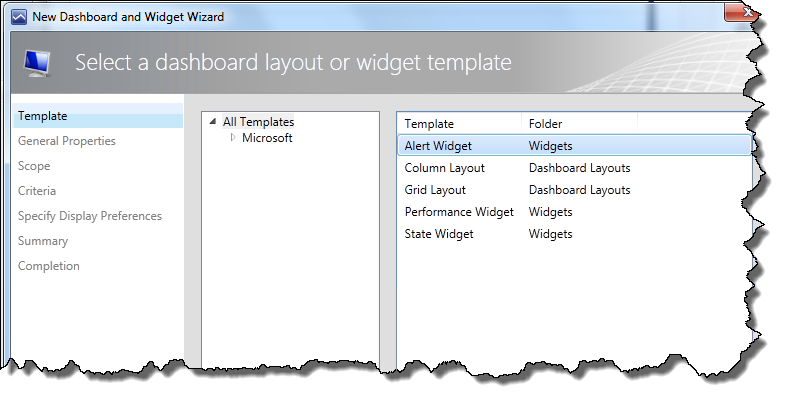
Step 1: In an empty dashboard cell, click on the “Click to add widget” link. This opens the New Dashboard and Widget Wizard .
Step 2: Now you are presented with a selection of the available widgets. Select Alert Widgets and then click Next.
Step 3: Once you give your widget a name and a description, you can choose a group or object for which to display alerts. The ability to select between “Groups” and “Groups and objects” allows you to change the scope of objects for which you will receive alerts. If you only want to target a certain object within a group or class, the “Groups and objects” option allows you to do so, while the “Groups” option enables you to view alerts for all objects within the group you choose.

Step 4: Next you can specify the criteria for the alerts you will receive. You may choose the Severity, Priority, and Resolution State of the alerts. For example, I will receive alerts for warnings and information of all priority, and in either the new or closed state.

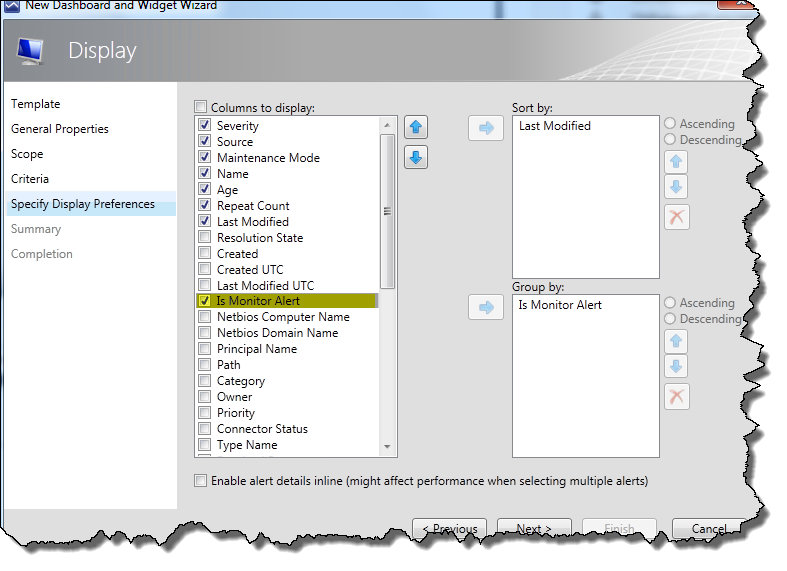
Step 5: Lastly, select the columns to display for each alert. You can also decide how the alerts are sorted by default as well as how they are grouped.
One great addition to the alert widget that is not present in the alert view is the addition of the “Is Monitor Alert” column. This column allows you to see whether the alert was generated by monitor rather than a rule. In my example, I will group alerts by “Is Monitor Alert” and sort by “Last Modified”.
And there you have it. We’ve configured a dashboard with a powerful alert widget. It is a great way to quickly view the alerts you care about organized in the way you want.

If you aren’t satisfied with your configuration or if your needs change, you can always click the


Thanks for reading, and don’t forget to keep up with the Operations Manager Team Blog for new information about widgets and dashboards!
You must be a registered user to add a comment. If you've already registered, sign in. Otherwise, register and sign in.