Turn on suggestions
Auto-suggest helps you quickly narrow down your search results by suggesting possible matches as you type.
- Home
- System Center
- System Center Blog
- New SCOM Web Console – Blog series (Post 4/5): The all new Drilldown experience
New SCOM Web Console – Blog series (Post 4/5): The all new Drilldown experience
- Subscribe to RSS Feed
- Mark as New
- Mark as Read
- Bookmark
- Subscribe
- Printer Friendly Page
- Report Inappropriate Content
Published
Feb 16 2019 04:39 AM
3,445
Views
Feb 16 2019
04:39 AM
Feb 16 2019
04:39 AM
First published on TECHNET on Feb 12, 2018
This blog aims at introducing the all new drilldown experience added as part of the new dashboard with SCOM 1801 release. For details on implementation and other parameters please refer to the
After going through this blog a user would:
The new SCOM dashboards come with the drilldown feature which, as the name suggests, allows you to drilldown into a problem and get more insights about the situation. This is helpful in root causing the issue and in identifying what all components are affected by the problem. There are five type of drilldown pages:
These pages are dashboards of their own comprising of different widgets. The widgets present in these dashboards take up the context at runtime and scope their data to the current target entity. For ex. take a look at the below URL for alert drilldown page:
http://<server_name>/OperationsManager/#/monitoring/drilldown/alert/ 023e5e00-e9e9-4d81-8135-052bf935062f / dashboard/d0d82ac8-215b-3b77-7a3b-8bef450796e3?mpId=da187e72-b9d7-9e16-d098-3b0a624dc38c&show_full_screen_link=false&hide_header=true
The highlighted section tells the Alert drilldown page to display data in all widgets targeted to this alert. This makes sharing the drilldown pages within the organization super easy. All you need to do is share the URL and people can start off from there.
Well, the next obvious question is how to use the drilldown feature? The answer to that is simple. Some of the widgets discussed in 2. The all new HTML5 widgets and their actions allow you to click a row/entity from the data. Once you make your selection the drilldown page is launched. For ex. consider the state widget below:
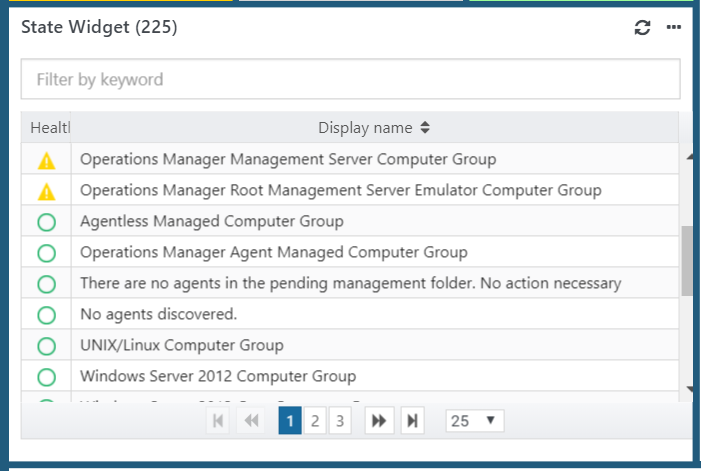
Now when you click on any of the row above the Group/Object drilldown page is launched. That page then has widgets displaying all sorts of relevant data targeted to the selected row from the state widget.
The starting point of drilldown could be either a row from the alert widget, a row from the state widget or a health icon from the topology widget. The user can then navigate to the other drilldown pages by clicking on items present in the widgets of the current drilldown page. Below diagram shows the path a user can navigate during drilldown.

For ex: from a State widget the user can drilldown and land at the SCOM Group/Object drilldown page and from there they can click one of the unhealthy monitors and land up in the Monitor Drilldown page.
The alert drilldown page contains detailed information about the alert. Below is a screenshot of how the alert drilldown page looks like:

As clear from the above screenshot the alert drilldown page has 6 widgets. These represent the following data from left to right and top to bottom:
Many a times there are alerts which come up frequently in an environment. You might want to add information for your fellow operators to help them save time. But you don't have access to Operations Console and an active Word deployment. This is where the Company knowledge widget in alert drilldown comes in handy. Just click the alert and once the "Alert drilldown page" opens up start editing the company knowledge without having to depend on Word or Operations Console.
The SCOM Group/Object drilldown page shows detailed information about a SCOM Group/Object. Below is a screenshot of a sample SCOM Group/Object drilldown page:

As is evident from above the SCOM Object/Group page consists of 2 dashboards. The first one is the object information dashboard. This dashboard consists of 5 widgets:
The second one is the Performance dashboard. This dashboard shows one performance widget each for every performance object of the current entity. Below is an example:

This section tries to narrate a few possible scenarios which you might face regularly and where drilldown can really come in handy.
In this case the user can click that server in the state widget and can launch the SCOM Group/Object drilldown page. Here you will find lots of valuable information which'd help you root cause and figure out the issue.
What all can you do to investigate the issue?
You are highly likely to discover the root problem with the above-mentioned steps. If not, then keep drilling down wherever you find anything suspicious.
Now is a good time to check for the performance data collected from the server. Simply select the server from a state widget and then once the "SCOM Group/Object drilldown page" opens, select the 2 nd tab "Performance". Here you'd see all the performance data collected from the server and you most probably should see a spike or abnormal behavior.
The SCOM Class drilldown page gives information about a SCOM class. Below is a sample screenshot of how the SCOM class page looks like:

This drilldown page has 3 widgets:
Not only that you can then even go ahead and look up those rules/monitors and even modify their company knowledge.
The Rule drilldown page shows detailed information about a SCOM Rule. Below is a sample screenshot:

The Rule drilldown page has 4 widgets.
The Monitor drilldown page shows detailed information about a SCOM Monitor. Below is a sample screenshot:

The Monitor drilldown page has 3 widgets.
Recommended Next: New SCOM Web Console – Blog series (Post 5/5): Sample Custom Dashboard walkthrough
About
This blog aims at introducing the all new drilldown experience added as part of the new dashboard with SCOM 1801 release. For details on implementation and other parameters please refer to the
After going through this blog a user would:
- Understand what the new drilldown feature is.
- Get a brief understanding of how drilldown feature can be used for better monitoring.
The all new Drilldown experience
The new SCOM dashboards come with the drilldown feature which, as the name suggests, allows you to drilldown into a problem and get more insights about the situation. This is helpful in root causing the issue and in identifying what all components are affected by the problem. There are five type of drilldown pages:
- Alert page
- SCOM Group/Object page
- SCOM Class page
- Rule Page
- Monitor Page
These pages are dashboards of their own comprising of different widgets. The widgets present in these dashboards take up the context at runtime and scope their data to the current target entity. For ex. take a look at the below URL for alert drilldown page:
http://<server_name>/OperationsManager/#/monitoring/drilldown/alert/ 023e5e00-e9e9-4d81-8135-052bf935062f / dashboard/d0d82ac8-215b-3b77-7a3b-8bef450796e3?mpId=da187e72-b9d7-9e16-d098-3b0a624dc38c&show_full_screen_link=false&hide_header=true
The highlighted section tells the Alert drilldown page to display data in all widgets targeted to this alert. This makes sharing the drilldown pages within the organization super easy. All you need to do is share the URL and people can start off from there.
How to drilldown?
Well, the next obvious question is how to use the drilldown feature? The answer to that is simple. Some of the widgets discussed in 2. The all new HTML5 widgets and their actions allow you to click a row/entity from the data. Once you make your selection the drilldown page is launched. For ex. consider the state widget below:
Now when you click on any of the row above the Group/Object drilldown page is launched. That page then has widgets displaying all sorts of relevant data targeted to the selected row from the state widget.
Which drilldown page leads to where?
The starting point of drilldown could be either a row from the alert widget, a row from the state widget or a health icon from the topology widget. The user can then navigate to the other drilldown pages by clicking on items present in the widgets of the current drilldown page. Below diagram shows the path a user can navigate during drilldown.
For ex: from a State widget the user can drilldown and land at the SCOM Group/Object drilldown page and from there they can click one of the unhealthy monitors and land up in the Monitor Drilldown page.
Drilldown pages deep dive
Alert drilldown page
The alert drilldown page contains detailed information about the alert. Below is a screenshot of how the alert drilldown page looks like:
As clear from the above screenshot the alert drilldown page has 6 widgets. These represent the following data from left to right and top to bottom:
- Alert description: Here you will get detailed description for the alert like the workflow name, instance name etc.
- Alert context: All the context information for this alert would be displayed here
-
Company knowledge: Any added company knowledge for the underlying rule or monitor for this alert would be displayed here. Read the text in the company knowledge widget above, you may discover a cool new feature :smiling_face_with_smiling_eyes:. Yes, you read it right, now SCOM supports adding HTML based company knowledge right from the Web Console.
Just hit the ellipses icon ( … ) and you shall see a “Edit Company Knowledge” action. Fill in the company knowledge in the editor that shows up, choose the MP and hit save!
Below are just some screenshots showing the flow:
-
Select the action
-
Enter the company knowledge
-
Choose MP (or create new one) and save
-
Select the action
- Product knowledge: Here you will see the product knowledge added for the corresponding rule or monitor.
- Rule Properties: Would display the properties of the rule that generated this alert. It is blank in the above screenshot since this alert came from a monitor.
- History: Would show the history of changes to the resolution state of the alert.


Use cases
Scenario 1: Adding company knowledge without the burden of desktop console and Word
Many a times there are alerts which come up frequently in an environment. You might want to add information for your fellow operators to help them save time. But you don't have access to Operations Console and an active Word deployment. This is where the Company knowledge widget in alert drilldown comes in handy. Just click the alert and once the "Alert drilldown page" opens up start editing the company knowledge without having to depend on Word or Operations Console.
SCOM Group/Object drilldown page
The SCOM Group/Object drilldown page shows detailed information about a SCOM Group/Object. Below is a screenshot of a sample SCOM Group/Object drilldown page:
As is evident from above the SCOM Object/Group page consists of 2 dashboards. The first one is the object information dashboard. This dashboard consists of 5 widgets:
- Object relationship and properties widget: This widget shows all the related objects to the current object along with their properties to the right. You can select any of the items from this diagram and the properties on the right would get updated. Notice the small health state icons on top of each entity. This would help you figure out if there are any related entities which are at the crucial stage too!
- Warning and critical alerts generated on this object
- The unhealthy monitors targeted on the current object. This is a really useful widget and can effectively tell you about the root cause for the critical or warning health state of the entity.
- Performance metrics: This widget is like a “Object By Performance Widget” and displays all the performance metrics related information for the current target object.
- Classes widget: All the classes the current entity belongs to is displayed in this widget.
The second one is the Performance dashboard. This dashboard shows one performance widget each for every performance object of the current entity. Below is an example:
User cases
This section tries to narrate a few possible scenarios which you might face regularly and where drilldown can really come in handy.
Scenario 1: A server in the environment is reporting a critical health state
In this case the user can click that server in the state widget and can launch the SCOM Group/Object drilldown page. Here you will find lots of valuable information which'd help you root cause and figure out the issue.
What all can you do to investigate the issue?
- Check the related objects widget and see if some underlying entity is critical. For example, the hard drive might on the server may be critical (say because of less space) and thus the health of the server rolled up to be critical. Now you know you need to check the hard drive. This way you can keep drilling down and get to the root cause of the issue
- Check the currently active alerts generated on this server. There would most probably be an alert sitting there clearly calling out the problem.
- Check the unhealthy monitors widget if it contains any entries.
- Check the performance metrics and see if there is any unusual behavior or spikes.
You are highly likely to discover the root problem with the above-mentioned steps. If not, then keep drilling down wherever you find anything suspicious.
Scenario 2: A server is reporting delays and unexpected behavior
Now is a good time to check for the performance data collected from the server. Simply select the server from a state widget and then once the "SCOM Group/Object drilldown page" opens, select the 2 nd tab "Performance". Here you'd see all the performance data collected from the server and you most probably should see a spike or abnormal behavior.
SCOM Class drilldown page
The SCOM Class drilldown page gives information about a SCOM class. Below is a sample screenshot of how the SCOM class page looks like:
This drilldown page has 3 widgets:
- Class properties widget displaying all the properties of the class
- Rule widget: Showing information about all the rules targeted to this class
- Monitor widget: Showing information about all the monitors targeted to this class
Use Cases
Scenario 1: Figuring out all targeted rules and monitors of a class
Not only that you can then even go ahead and look up those rules/monitors and even modify their company knowledge.
Rule drilldown page
The Rule drilldown page shows detailed information about a SCOM Rule. Below is a sample screenshot:
The Rule drilldown page has 4 widgets.
- The rule properties widget displaying all the properties of the rule.
- A rule configuration widget displaying the configuration of the rule as present in the management pack
- A company knowledge widget where the user can see the company knowledge for this rule. Users can also edit the company knowledge here if they have sufficient permission.
- A product knowledge widget where the user can see the product knowledge for the rule.
Use Cases
Scenario 1: You want to check the rule properties and/or modify the company knowledge
Monitor drilldown page
The Monitor drilldown page shows detailed information about a SCOM Monitor. Below is a sample screenshot:
The Monitor drilldown page has 3 widgets.
- The monitor properties widget displaying all the properties of the monitor.
- A company knowledge widget where the user can see the company knowledge for this monitor. Users can also edit the company knowledge here if they have sufficient permission.
- A product knowledge widget where the user can see the product knowledge for the monitor.
Use Cases
Scenario 1: You want to check the monitor properties and/or modify the company knowledge
Recommended Next: New SCOM Web Console – Blog series (Post 5/5): Sample Custom Dashboard walkthrough
0
Likes
You must be a registered user to add a comment. If you've already registered, sign in. Otherwise, register and sign in.