- Home
- System Center
- System Center Blog
- Monitor Windows Storage Spaces Direct 2016/2019 with SCOM Management Pack
- Subscribe to RSS Feed
- Mark as New
- Mark as Read
- Bookmark
- Subscribe
- Printer Friendly Page
- Report Inappropriate Content
SCOM have revamped the old S2D 2016 MP and have added a whole list of new features to enable you with monitoring of entire S2D stack all the way from Physical disks to CSVs/File shares.
Download the preview version today https://www.microsoft.com/en-us/download/details.aspx?id=100782 and tell us in comments what you like/dislike about this release. To help you get started, there is a MP guide along with the MP. Please see detail instructions on how to install this MP which is very easy to follow.
For our readers who don't want to go through the entire post, the highlight of this release are captured:
1. Storage Pool health and performance monitoring
2. Storage Node health and performance monitoring
3. Physical disks health and performance monitoring
4. Volumes health, performance, deduplication status, resiliency type.
Note: The CTP guide have all these details captured. Please check it out before installing the MP.
-----------------------------------------------------------------------------------------------------------------
Windows Server Storage Spaces Direct 2019 has enabled performance counters for various components which are documented here.
The latest S2D MP now supports all these performance counters to make it useful for the admins and operators to see the overall health and performance of clusters.
For our readers, who are interested to know more, let's see in bit detail what all this MP offers.
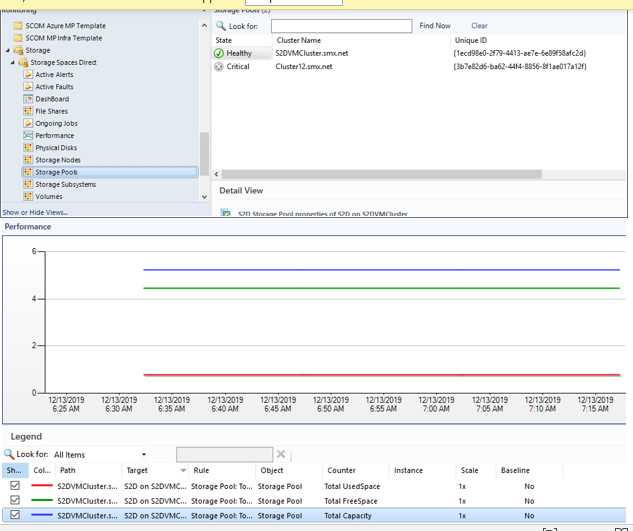
1. Storage Pool Monitoring: When multiple clusters are deployed, you want to see the health of the storage pool which these clusters are using. If the storage pool health is in critical/warning state, you would like to receive a SCOM alert with the description to root cause the underlying issue. This entire experience is possible now by S2D MP. The storage pool health and performance metrics gives you an overview of storage pool. As we monitor multiple cluster, the cluster name is associated with storage pool. For each storage pool we can check the performance to view the storage capacity and may take actions as per the situation.
The severity and the health of the S2D components, that is shown by S2D MP is defined by the health faults which are well documented here. This ensures that health shown by the cluster manager or scom stays in sync.
2. Storage Node Monitoring: The other important piece of a cluster is the storage node that forms your cluster. For monitoring we want to see what all nodes form our cluster, and the health and performance of these nodes. We may want to increase the number of nodes in the cluster, if we see the current nodes are being exhausted.
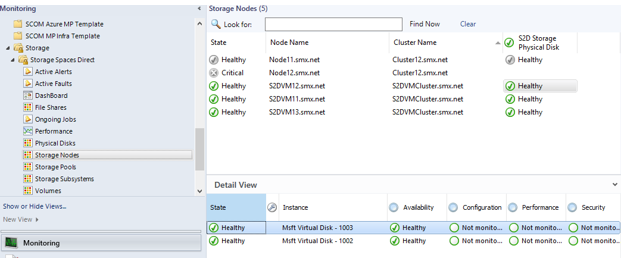
We can see all the nodes and corresponding cluster under Storage Node. There will be a rule which monitors any error related to Node and fires an alert if an error occurs. With alert description, you take an action immediately and make your cluster healthy and happy again. How COOL is that !! :)
Below is the screenshot that shows that we have total 5 servers. 3 servers form cluster and 2 server forms other cluster.
Besides health of node, the Physical disk column shows the health of the disks attached to the nodes for a quick overview. If you want to see the performance of any node, just right click and go to the performance view. Select the counters and as always SCOM will draw a beautiful graph for it.
Are you still with me?? Great, let's see the other cool feature that we have added to S2D MP for YOU !!
3. Physical Disks monitoring: Now that our compute is healthy and taken care for our cluster, let's dig a little to the storage side. Let's see what all type(HDD. SSD..) of physical disks are part of our cluster, and how much storage we are getting from these. All this data enables us to take preventive measure in the scenarios where we might have to increase the cache/capacity drive based on the usage. Again there are rules running, which will fire an alert when an error occurs for disks.
For the performance metrics, just right click the disk and all the performance counters are displayed.
4. CSV Monitoring: Now that we have checked the health and performance of all the different components of our cluster starting from physical disk to storage pool. Next let;s see what all CSVs we have, what is the resiliency type and deduplication status of various volumes across our clusters.
A consolidated view of the health of all the CSV's with media type, size, resiliency type and dedup status helps admin to easily manage and monitor the cluster. Alerts will help if the volume is filling up or if there is any error.
5. Network Monitoring: Network monitoring is crucial when we are deploying a cluster using multiple components. A rule is checking for any network error and will fire an alert for you as soon as some network related error occurs.
Hope this helps and you like this new version that we have released for you. Please share this post if this can help others.
DLC link with MP guide is available at https://www.microsoft.com/en-us/download/details.aspx?id=100782
Please do share with us in comments your experience with this MP. You can directly send me a message if you face any difficulty with this MP.
Thanks,
Neha
You must be a registered user to add a comment. If you've already registered, sign in. Otherwise, register and sign in.


