- Home
- System Center
- System Center Blog
- Analyze System Center cubes using Excel
- Subscribe to RSS Feed
- Mark as New
- Mark as Read
- Bookmark
- Subscribe
- Printer Friendly Page
- Report Inappropriate Content
The Service Manager 2012 data warehouse provides users with 7 cubes out of the box.
Here is the SM console with Cubes view

SM Console Cube View Description
The bottom pane of the console shows the Measures, Dimensions and KPIs available on the selected cube.
Users can process the cube if it’s in the unprocessed state from the Task pane
Also the Link “Analyze cube in Excel” opens Excel with a connection created to the Analysis services Database and the cube.
Simple Report
Let’s see how we can browse the cubes to find the required information. I would like to create a simple report to show Active incident status by California users with Source and priority info in few steps .
1) To answer the question, we need to figure out the Cube which would contain the corresponding measure
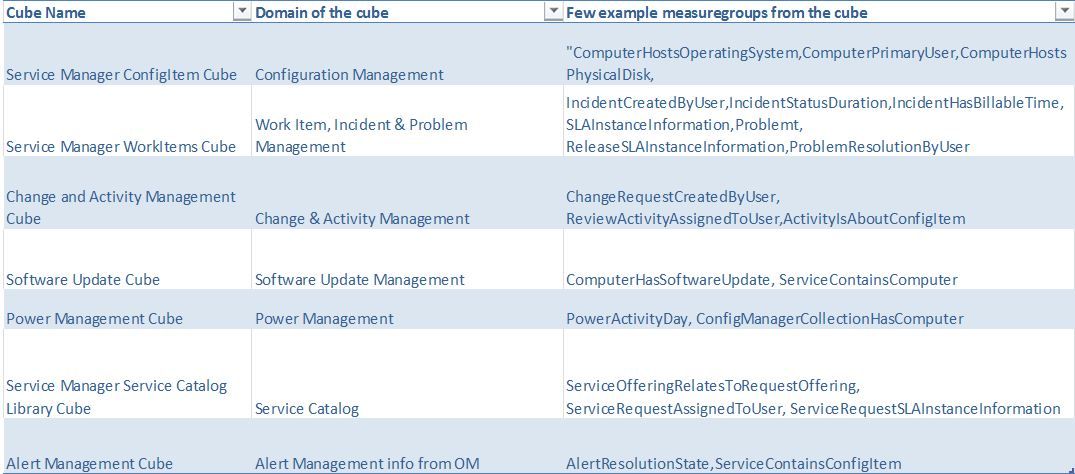
So basically here is the overview of the cubes created out of box..
Also you may explore the measures available in each cube from the SM console or any OLAP client (Excel, SQL Server Management studio, or Business Inteligence Development Studio) by connecting it to the Analysis Services Database.
As we need a measure related to incidents to answer the question What is the number of active incidents by California users with Source and priority info?”, we need to explore the System Center WorkItems cube.
2) Click on the Link “Analyze cube in Excel” in the SM console Cubes view by selecting the System Center WorkItems cube which opens an Excel workbook with a data connection to the OLAP database and the WorkItems cube.

Note: Microsoft Excel full version is required to browse the cubes; Excel viewer will not suffice. Also, restart the SM console after Excel installation if it’s open during Office installation.
3) The list of measure groups can be overwhelming so you may reduce the size of the dimension list by selecting the measure group you need from the “Show Fields related to” dropdown.
Select the IncidentDim measure group in the “Show fields related to” drop down and check the “Incidents Active” measure checkbox. This which will show the active incidents in the pivot table.

4) Check the Incident Source from the IncidentDim_IncidentSource and Impact cube dimensions to slice the Active Incidents by source.

Also select the IncidentImpactVAlue from the IncidentDim_IncidentImpact dimension to add another slice by impact.

5) Drag and drop the report filter CreatedByUserDim.State property and select CA from the report filter Drop down

So here is the snapshot of the report

The SM cube processing job runs on a daily schedule by default and processes the latest information, so you may save the Excel workbook and just refresh it to obtain the latest information daily .
I hope this helps you to start playing with the cubes available with SM 2012!
You must be a registered user to add a comment. If you've already registered, sign in. Otherwise, register and sign in.