- Home
- Security, Compliance, and Identity
- Security, Compliance, and Identity Blog
- Client Health in Configuration Manager 2012 Beta 2
- Subscribe to RSS Feed
- Mark as New
- Mark as Read
- Bookmark
- Subscribe
- Printer Friendly Page
- Report Inappropriate Content
[Today’s post is provided by Abraham Wang ]
It’s often the case that many customer-reported issues with a Configuration Manager feature are because the Configuration Manager client itself is not working, rather than a problem with the specific feature. However, it’s not always easy for administrators to know that this is the root cause and be able to answer the following questions:
- How many clients are healthy in my hierarchy?
- How many clients are inactive in my hierarchy because they have been powered off for a long time or because the Configuration Manager client is uninstalled?
- What is the main cause of unhealthy clients in my hierarchy?
These questions are very important for Configuration Manager administrators. However, in Configuration Manager 2007 and previous versions, it’s not easy to find the answers to these questions. Configuration Manager 2012 addresses this problem with the improved Client Health feature.
Client Health Overview
The Configuration Manager 2012 client runs a scheduled task to evaluate its client health status (by default at mid night) and sends evaluation result to the site server by using state message if there is any change in the evaluation result. If state messages fail to send, FSP (Fallback status point) will be used to deliver the evaluation results. So it is a good idea to deploy FSP in the hierarchy. Otherwise some evaluation results may not be received by site server. The site server summarizes the client health evaluation results and the client activities, and displays these in the Configuration Manager console.
Client Health Data in the Configuration Manager Console
You’ll see the client status data (client health and client activity) in the Monitoring workspace when you click the Client Status node, as shown in the following picture.

Note: This is prerelease UI and is subject to change.
When you click the Client Status node, the results pane displays some statistics and the Recent Alerts section. The statistics have a graphical display of how many clients are healthy, unhealthy or unknown; active or inactive. The Recent Alerts show the alerts that have been generated as a result of meeting defined thresholds for client health and client activity.
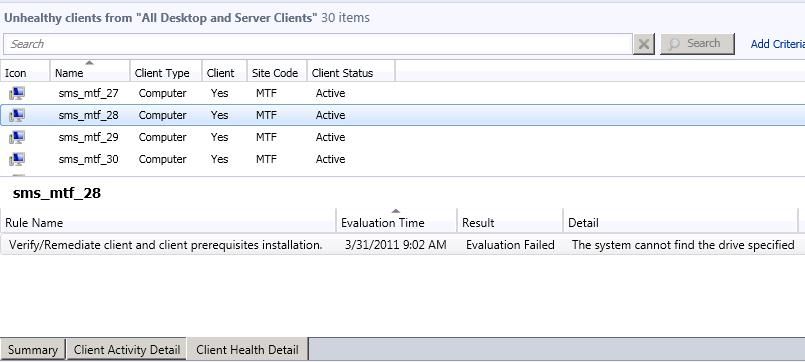
If you click different areas of the pie charts, this creates temporary collections for selected areas and the console automatically changes to the Assets and Compliance workspace. For example, if you click the red area in the Client Health pie chart (clients that failed the Client Health checks), this creates a temporary collection for these unhealthy clients that is automatically selected, as shown in the following picture.

In the results pane, when you select a computer, you will see three tabs available in the details pane: Summary, Client Activity Detail and Client Health Detail. The next picture shows example data for the Client Health Detail tab where the computer failed the client health evaluation rule “Verify/Remediate client and client prerequisites installation.” You can use this information as a starting point for more detailed trouble-shooting on the client. In our example, this might involve checking the ccmsetup.log file for errors to help identify the root cause of the problem.
In addition to this information in the Configuration Manager Console, you can also use the Client Health reports. After you have installed and configured a reporting services point role, the Client Health reports are located in the “Client Health” path, as shown in the following picture.

How to Configure Client Health: Client Status Settings
In the Configuration Manager console, in the Monitoring workspace, click the Client Status node. On the ribbon, in the Home tab, you’ll see three buttons for Client Health, as shown in the following picture.

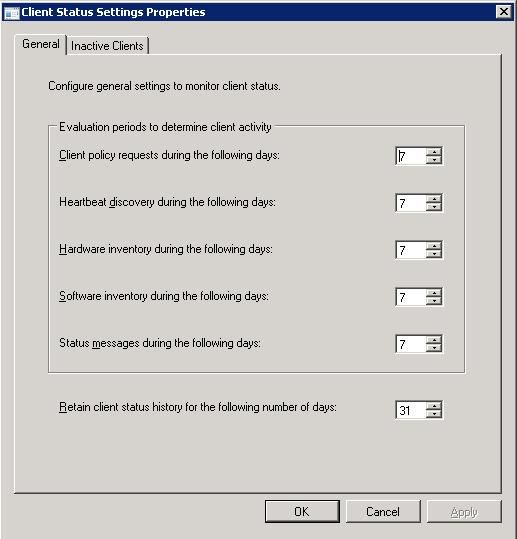
When you click Client Status Settings, you see the Client Status Settings Properties dialog box, as shown in the next picture.
The General tab contains the thresholds settings, such as “Client policy requests” and “Heartbeat discovery”. These thresholds determine if the client is active. For example, when the hardware inventory threshold is set to 7 days and the site server has not received hardware inventory data from a client for more than 7 days, the threshold is reached and the client is considered inactive for hardware inventory. When a client is inactive for all the listed activities, it is considered an inactive client.
The Inactive Clients tab allows you to enable the option for the site server to retrieve the LastLogonTimeStamp data from Active Directory Domain Services. This information indicates whether the computer is still active in Active Directory Domain Services.

How to Configure Client Health: Refresh Client Status and Schedule Client Status Update
Each primary site server runs a SQL stored procedure (CH_UpdateAll) to summarize the client health and client activity information. By default, this runs once a day. The charts in the Client Status node use this summarized information, which means that the charts are not real-time and by default, they have up to a day’s delay.
To see the latest information, click the Refresh Client Status button, which runs the stored procedure. When this finishes, the charts are refreshed with the latest summarized data. You can also configure how often the stored procedure runs by clicking the Schedule Client Status Update button. However, we recommend that you use the default setting for the schedule because the site server performance decreases when the procedure runs too frequently.
How to Configure Client Health: Create Alerts
The Client Health feature is integrated with the alerts that you see in the Configuration Manager console. To configure alerts for Client Health, follow these steps:
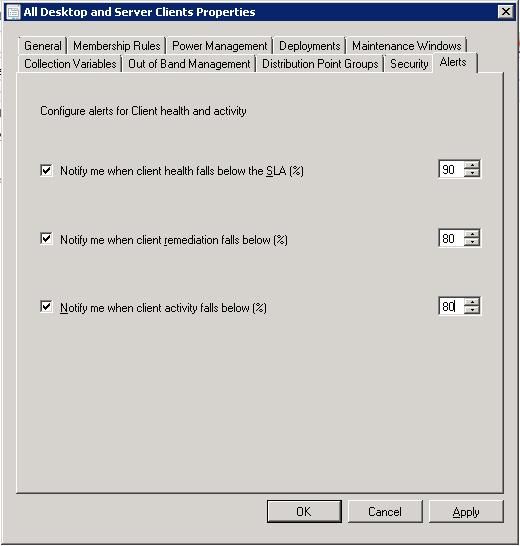
1. In the Assets and Compliance workspace, click Device Collections. Right-click the collection for which you want to create alerts, and then click Properties.
2. Click the Alerts tab. Select and configure the options for the client health and activity alerts, and then click OK. An example configuration is shown in the following picture.
After you have configured the alerts for a collection, the alerts that are generated display in the Alerts node in the Monitoring workspace. You will also see the alerts in the Client Status node if the alerts are triggered, as shown in the following picture.
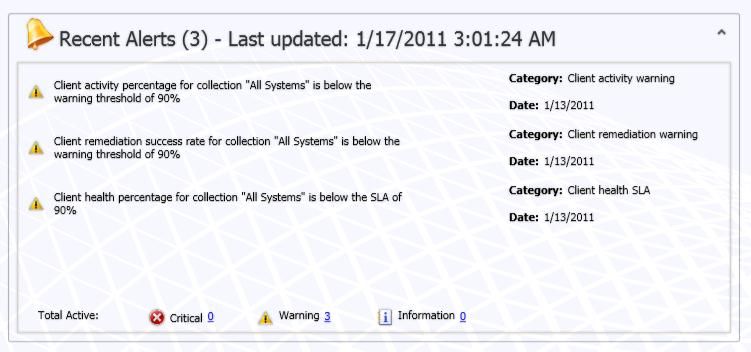
Note that the alerts are based on data from the hierarchy and not just the site. So when an alert is active, it means that the threshold is reached for hierarchy. It’s possible that the threshold is not reached for the primary site that you are currently connected to.
Client Health: Client Component
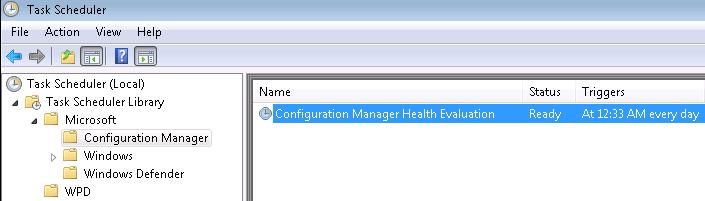
The Client Health evaluation engine is an executable file named ccmeval.exe, which is installed with the Configuration Manager client and runs on computers. It does not run on mobile devices. When the Configuration Manager client is installed, the install process creates a scheduled task named “Configuration Manager Health Evaluation”. This task runs ccmeval.exe at a time between 12:00 AM and 1:00 AM.
When ccmeval.exe runs, it loads a configuration file named ccmeval.xml. This file contains the Client Health evaluation rules. You can open the file to read the rules but it’s not supported to change this file. If you do so, the evaluation might fail or the site server might reject the evaluation results.
If the computer is powered off or in sleep mode when the scheduled Configuration manager Health Evaluator task is due to run, it automatically runs as soon as it can – for example, when the operating system is loaded or brought out of sleep mode.
Conclusion
The Client Health feature in Configuration Manager 2012 offers some exciting improvements over previous versions, which can help to keep your Configuration Manager hierarchy running smoothly. You can quickly see the Client Health data in the Configuration Manager console by using the pie charts, temporary collections, and alerts. You can also use the reports for more detailed information.
To configure Client Health, configure the Client Status Settings to define the thresholds for client health and client activity. Then configure alerts for the collections. There is nothing to configure on the client; this is done automatically by Configuration Manager when the client is installed.
-- Abraham Wang
This posting is provided "AS IS" with no warranties, and confers no rights.
You must be a registered user to add a comment. If you've already registered, sign in. Otherwise, register and sign in.