- Home
- Security, Compliance, and Identity
- Core Infrastructure and Security Blog
- Performance Data and Views in OpsMgr 2007
- Subscribe to RSS Feed
- Mark as New
- Mark as Read
- Bookmark
- Subscribe
- Printer Friendly Page
- Report Inappropriate Content
First published on MSDN on Feb 18, 2008
Suppose you want to create a view to look at performance data that has been collected in OpsMgr. You go to create the view and are prompted for a performance counter name. You copy and paste the performance counter name just as it appears in performance monitor on the system of interest and, you see no data come up. So how do you know if this is normal (because OpsMgr isn't collecting that performance counter) or whether there is a problem? Lets discuss how we can make this determination in the OpsMgr console.
In order to display performance data in a view we must have a RULE to collect data from the specific counter of interest. Notice I wrote RULE in all capital letters. I did that to make a point. In OpsMgr 2007 all data collection (events, perf, whatever) is handled by rules - not monitors. Monitors are solely used for monitoring health state. Rules are used for any data collection. So thats where we need to look - do we have a rule that is configured to collect the peformance counter we are interested in? Assuming we have named all of our performance rules with the name of the counters they collect - all we have to do is search the rule names and see if any rule exists. But, in practical terms, it very likely isn't that easy. Assume, for example, that we have a performance collection rule titled Netlogon Performance Rule 1. That rule is configured to collect data from the new (available with hotfix 928576) 'average semaphore hold time' performance counter. Unless we know this particular rule is the one that collects that counter it is difficult to find. But there is a very easy way to determine all of the performance counters OpsMgr knows about and are configured for data collection - and what rule is actually doing the work to collect the data!
To obtain a list of all performance counters currently being monitored by OpsMgr, create a generic (unfiltered) performance view - this view definition would be similar to the following.

Select OK to save the view and then click on the view to display the results. The results will be similar to the below example.
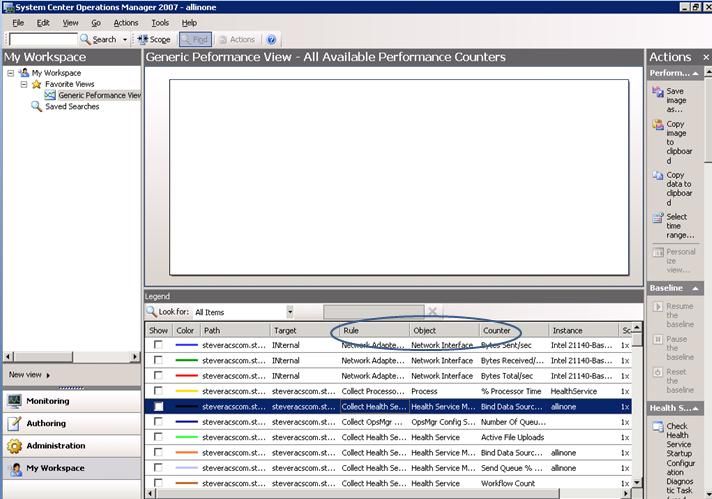
Notice that both the performance counter and the rule that collected the counter are displayed together.
What if we want to see all performance counter data that is being collected from a particular computer? That is equally easy - just navigate to monitoring > computers and right-click on the computer of interest. On the right-click menu, select open > Peformance View. This will display a screen similar to the following which will show all counter data available for the selected system.

You must be a registered user to add a comment. If you've already registered, sign in. Otherwise, register and sign in.