- Home
- Security, Compliance, and Identity
- Microsoft Sentinel
- Re: No Analytics Rule for Dark Trace??
No Analytics Rule for Dark Trace??
- Subscribe to RSS Feed
- Mark Discussion as New
- Mark Discussion as Read
- Pin this Discussion for Current User
- Bookmark
- Subscribe
- Printer Friendly Page
- Mark as New
- Bookmark
- Subscribe
- Mute
- Subscribe to RSS Feed
- Permalink
- Report Inappropriate Content
Nov 06 2021 11:25 PM
Hello,
We have a client having Dark Trace installed within their environment and we have Data Connector enabled. however I dont see any Analytics rule associated with Dark Trace. Is it to any worth to integrate Dark Trace with Azure Sentinel??
Since to-date I have never seen any alert being generated, while if I go to the Dark Trace workbook it shows some malicious activities?? Just want to understand the value of the integration?? Are the events from workbook considered malicious, if yes then why no Analytics rule in place to trigger incidents??
Thanks
Fahad.
- Mark as New
- Bookmark
- Subscribe
- Mute
- Subscribe to RSS Feed
- Permalink
- Report Inappropriate Content
Nov 07 2021 12:10 PM - edited Nov 07 2021 12:11 PM
@FahadAhmed You will see that a lot of the data connectors, especially those written by third parties, do not have any associate analytic rules. It is up to the 3rd party as to what to provide with their data connector. Hopefully, with the advent of the Content Hub, this will happen less and less as the analytic rules can be combined with the data connectors.
Based on the description of the Darktrace workbook, I would say the malicious activities shown are indeed items that need to be investigated. I would also suggest looking at the KQL in the workbook and seeing if you can use that to make your Analytics rules to create the alerts.
- Mark as New
- Bookmark
- Subscribe
- Mute
- Subscribe to RSS Feed
- Permalink
- Report Inappropriate Content
Nov 08 2021 01:48 AM
- Mark as New
- Bookmark
- Subscribe
- Mute
- Subscribe to RSS Feed
- Permalink
- Report Inappropriate Content
Nov 08 2022 12:38 AM
- Mark as New
- Bookmark
- Subscribe
- Mute
- Subscribe to RSS Feed
- Permalink
- Report Inappropriate Content
Nov 08 2022 12:31 PM
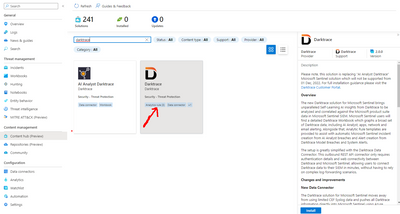
@Magnus Tengmo There are three out of the box now
or go to the Github: Azure-Sentinel/Solutions/Darktrace/Analytic Rules at f99d6c8fd39bb3751f41ed8dfe059f2b2c9d1130 · Azur...
- Mark as New
- Bookmark
- Subscribe
- Mute
- Subscribe to RSS Feed
- Permalink
- Report Inappropriate Content
Nov 14 2022 02:48 AM
- Mark as New
- Bookmark
- Subscribe
- Mute
- Subscribe to RSS Feed
- Permalink
- Report Inappropriate Content
Nov 14 2022 09:04 AM
CommonSecurityLog
| where DeviceVendor == "Darktrace"
Use the above as an incident rule to create a new alert per result returned. Then set the incident setting to create a new incident per alert (you could do some alert grouping or certain entities).
