- Home
- Security, Compliance, and Identity
- Microsoft Sentinel
- Re: Filter displayed alerts on the investigation panel
Filter displayed alerts on the investigation panel
- Subscribe to RSS Feed
- Mark Discussion as New
- Mark Discussion as Read
- Pin this Discussion for Current User
- Bookmark
- Subscribe
- Printer Friendly Page
- Mark as New
- Bookmark
- Subscribe
- Mute
- Subscribe to RSS Feed
- Permalink
- Report Inappropriate Content
May 03 2020 09:00 AM - edited May 03 2020 09:07 AM
Hello,
I have a scenario to trigger four alerts in my Sentinel instance. This scenario does not aims at detecting a real attack and does not necessarily make sense, but exists for testing purposes.
Scenario
Successfull RDP Brute force attack on a Windows Server 2012, followed by the execution of multiple process within a short time frame, then executing a program named "mimikatz". The logs are streamed from the server to Sentinel.
Triggered analytics rules
- Excessive logon failure
- Successfull brute force
- Anomalous process frequency
- Mimikatz detected
My alerts are all triggered, as shown on the picture below. Note that I filtered incidents on the last 24h. You may also notice that incidents were not triggered in the right date order, but this is an other issue I need to fix in my underlying KQL requests.
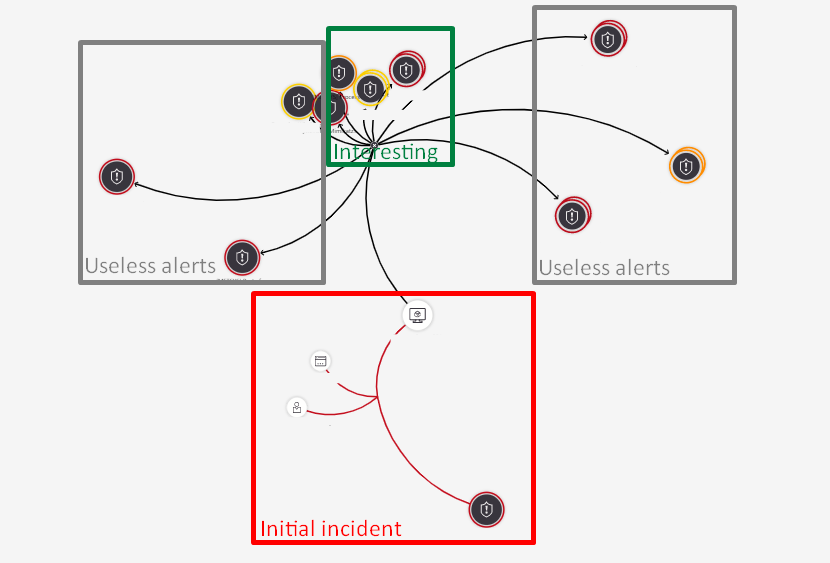
Problem: if I click on the Successfull brute force incident, and go to the navigation pane, I see my entities, such as the computer name, etc... But if I click my computer entity and display related alerts, I got too many alerts, including alerts I triggered days ago, and closed alerts, as shown on the picture below (red is the incident I initially inspected, grey is the useless alerts I don't want to see, green is the related alerts I want to see.)
My questions: is there a way to display only alerts triggered the last X hours ? Another issue regarding this investigation panel is that closed alerts are displayed, and as an analyst, it would be usefull to choose whether to display them or not.
Thank you all!
- Mark as New
- Bookmark
- Subscribe
- Mute
- Subscribe to RSS Feed
- Permalink
- Report Inappropriate Content
May 12 2020 04:30 PM
@ClémentB : it is a feature we are looking into. No ETA yet.
- Mark as New
- Bookmark
- Subscribe
- Mute
- Subscribe to RSS Feed
- Permalink
- Report Inappropriate Content
May 13 2020 12:00 AM

