- Home
- Security, Compliance, and Identity
- Microsoft Sentinel
- Failed Sign-in queries not working
Failed Sign-in queries not working
- Subscribe to RSS Feed
- Mark Discussion as New
- Mark Discussion as Read
- Pin this Discussion for Current User
- Bookmark
- Subscribe
- Printer Friendly Page
- Mark as New
- Bookmark
- Subscribe
- Mute
- Subscribe to RSS Feed
- Permalink
- Report Inappropriate Content
Mar 14 2019 01:16 AM
Hi all,
Today, I noticed that the queries to display failed sign-ins are not working. This is (one of) the queries used in the default Azure AD Sign-Ins dashboard:
- Mark as New
- Bookmark
- Subscribe
- Mute
- Subscribe to RSS Feed
- Permalink
- Report Inappropriate Content
Mar 15 2019 08:10 AM
@Eliav Levi: Is this something you can speak to?
- Mark as New
- Bookmark
- Subscribe
- Mute
- Subscribe to RSS Feed
- Permalink
- Report Inappropriate Content
Mar 15 2019 05:36 PM
I couldn't find which query in which dashboard this query was associated with. I clicked through all of the queries on the AD dashboard and didn't see this query in any of them. Do you mind giving me more information so I can find it?
Also, the query you showed is looking for error codes that do not appear in the list. (!in) I couldn't find any problems with the query but let me know if I am missing something.
In the query you showed, the "ErrorCode" column is an extended column displaying a dynamic data type derived from an integer data type ("errorCode"). Both columns are referring to the same data, just displayed differently. I put a query below to demonstrate the difference. I am not sure if this sheds light on this situation, so let me know if this doesn't address your concern.
- Mark as New
- Bookmark
- Subscribe
- Mute
- Subscribe to RSS Feed
- Permalink
- Report Inappropriate Content
Apr 02 2019 11:57 AM
@JulianGonzalez sorry for the belated reply. Because of travel (MVP summit) and some other engagements, I have not had much time to look into the Tech Community...
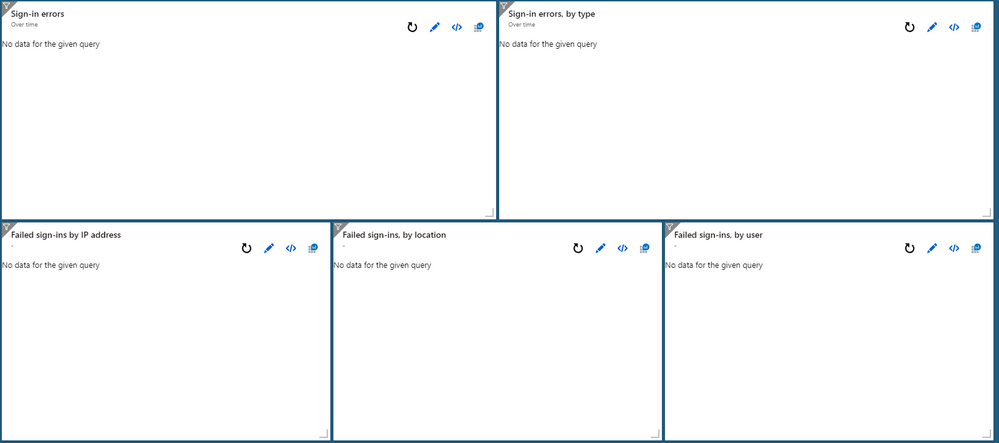
The query/queries I am referring to are part of the built-in Azure AD Sign-in logs dashboard (see screenshot below).
When looking into the query behind any of these given 'reports', the issue is the same. To view the query, I click "edit query".
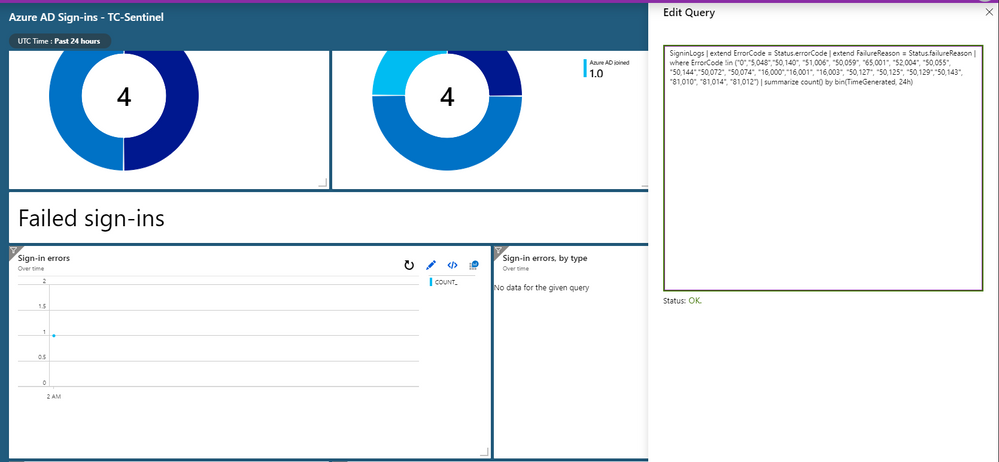
For example, the following is the query for the "Sign-in errors"-report:
SigninLogs | extend ErrorCode = Status.errorCode | extend FailureReason = Status.failureReason | where ErrorCode !in ("0","5048","50140", "51006", "50059", "65001", "52004", "50055", "50144","50072", "50074", "16000","16001", "16003", "50127", "50125", "50129","50143", "81010", "81014", "81012") | summarize count() by bin(TimeGenerated, 24h)
This query returns no results. However, when I update the query to the following, it works as expected:
SigninLogs | extend ErrorCode = Status.errorCode | extend FailureReason = Status.failureReason | where ErrorCode !in ("0","5,048","50,140", "51,006", "50,059", "65,001", "52,004", "50,055", "50,144","50,072", "50,074", "16,000","16,001", "16,003", "50,127", "50,125", "50,129","50,143", "81,010", "81,014", "81,012") | summarize count() by bin(TimeGenerated, 24h)
Note that I had to add the commas manually. Result in the screenshot below:
I hope this clarifies things?
- Mark as New
- Bookmark
- Subscribe
- Mute
- Subscribe to RSS Feed
- Permalink
- Report Inappropriate Content
- Mark as New
- Bookmark
- Subscribe
- Mute
- Subscribe to RSS Feed
- Permalink
- Report Inappropriate Content
Apr 12 2019 08:20 AM
- Mark as New
- Bookmark
- Subscribe
- Mute
- Subscribe to RSS Feed
- Permalink
- Report Inappropriate Content
Apr 12 2019 11:22 AM
Michael,
It appears your fix works because your IN statement is actually a NOT IN (!in) statement. So when you add the "," you're allowing the query to now search for those errors codes in which it was ignoring before.
When you're looking at the return data and if it has commas, normally this is a client side feature to make the data more readable.
Hope this helps,
Thanks!
- Mark as New
- Bookmark
- Subscribe
- Mute
- Subscribe to RSS Feed
- Permalink
- Report Inappropriate Content
Apr 12 2019 11:34 AM
Thanks, but my point is that I did not change the queries at all. These are the default queries from the default dashboard... The dashboard stopped working all of a sudden. Even more so, the queries are also a NOT IN (see my previous copy/paste).
More than happy to create a video to show you of that helps!
Thanks,
Michael
- Mark as New
- Bookmark
- Subscribe
- Mute
- Subscribe to RSS Feed
- Permalink
- Report Inappropriate Content
Apr 12 2019 12:37 PM
@Chris Boehm I figured creating a short video wouldn't hurt. In the video you'll see what I'm talking about. I'm opening the built-in dashboard for Azure AD Sign-Ins and notice some reports aren't working. I then just edit the built-in query and add the commas to get it back up-and-running. Nothing else.
The question isn't why my workaround works. But rather 1) why has this happened with this dashboard and 2) why do I need to add commas to my queries in this tenant, but not in other tenants (where the built-in reports just work fine)? Could this be due to region or language settings? Although I would expect those to be transparent to the backend...
Thanks,
Michael
- Mark as New
- Bookmark
- Subscribe
- Mute
- Subscribe to RSS Feed
- Permalink
- Report Inappropriate Content
Apr 14 2019 04:20 AM
As you say, in most tenants (and all that I have access to), the event IDs do not have a comma, and the dashboard works right. I suggest opening a support ticket to investigate what's unique to this tenant. As a first step providing here a sample of the raw events may help:
That said, not that as @Chris Boehm writes, the cause you update is a negation clause, so the dashboard works also if completely removed, just reporting on unneeded events. In practice, ErrorCode=0 would dominate which may make the chart awkward.
~ Ofer
- Mark as New
- Bookmark
- Subscribe
- Mute
- Subscribe to RSS Feed
- Permalink
- Report Inappropriate Content
Apr 15 2019 06:33 AM
Follow up to what Ofer has mentioned, run the follow query to see what events have been collected within your SignInLogs Security Events. See if any of them are outside of the query.
Example: over 24 hours showing a list of ErrorCode types.
- Mark as New
- Bookmark
- Subscribe
- Mute
- Subscribe to RSS Feed
- Permalink
- Report Inappropriate Content
Apr 15 2019 06:52 AM
I get 'similar' results to you. In my environment only a hit for code 50140. Also, the information returned is without a comma (as you would expect).
- Mark as New
- Bookmark
- Subscribe
- Mute
- Subscribe to RSS Feed
- Permalink
- Report Inappropriate Content
Apr 15 2019 07:52 AM
So based on that data, we see 0 events outside of the following:
- Mark as New
- Bookmark
- Subscribe
- Mute
- Subscribe to RSS Feed
- Permalink
- Report Inappropriate Content
Apr 15 2019 08:37 AM
Hey Chris,
Thanks. I've been staring blind on the fact the reports *did* work before... Odd though, but seems we're doing fairly well in our tenant, then...
-Michael


