- Home
- Security, Compliance, and Identity
- Microsoft Sentinel Blog
- Automating bulk onboarding of Azure IaaS and PaaS resources into Microsoft Sentinel
- Subscribe to RSS Feed
- Mark as New
- Mark as Read
- Bookmark
- Subscribe
- Printer Friendly Page
- Report Inappropriate Content
This blog was authored in collaboration with @Inwafula .
In recent years, cloud computing has grown in leaps and bounds due to its flexibility and agility in supporting business goals. Not surprisingly, the cloud also presents an equally attractive target for cyber attackers. This blog will focus on two key challenges as far as security monitoring goals for IaaS and PaaS resources on Azure are concerned:
- Securing current IaaS and PaaS digital estate by onboarding Microsoft Sentinel in bulk
- Automating newly created resources into Microsoft Sentinel
To address these challenges, the blog will cover the end-to-end process of onboarding Azure IaaS and PaaS resources into Log Analytics, enabling of related analytics(detection) rules and workbooks(dashboards), then attaching of automation playbooks to perform automatic remediation and SOC process activities.
Process Flow:
1. Onboard Azure IaaS and PaaS resources into a Log Analytics workspace enabled for Microsoft Sentinel.
2. Enable the built-in analytics rules associated with those resources, along with customized ones.
3. Creation of custom analytics rules
4. Attach automation playbooks to the analytics rules.
5. Enable workbooks available out of the box
Onboarding Resources to Microsoft Sentinel
Methodology: Uses PowerShell to connect to the Azure subscription, deploy an azure policy initiative in bulk using the JSON in the Github URL provided below, assign the initiative to whatever subscriptions you will include in Microsoft Sentinel, then using the remediation script attached to create bulk remediation tasks for all resource types with a few clicks.
Note: This does not impact any diagnostic setting profile that a resource is already associated with, but, it creates a new one pointing to the designated Microsoft Sentinel Log Analytics workspace
Prerequisites:
- Latest Az module is installed and imported.
- Successful authentication to Azure tenant with Owner privilege.
- Download the scripts and schema from : RaGerges/DiagLogs-to-LA-WS (github.com)
Steps:
- Connect PowerShell to Azure subscription using administrator credentials
- Run the below commands according to the deployment scope using the attached JSON
Subscription Level(Single subscription):
Select-AzSubscription -Subscription "<SubscriptionID>"
New-AzDeployment -Name "AzSentinel-Cloud-Monitoring-Initiative" -TemplateFile .\ARM-Template json -Location ‘UAE North’ -Verbose
Management Group Level (Multiple subscriptions):
Select main subscription:
Select-AzSubscription -Subscription "<SubscriptionID>"
New-AzManagementGroupDeployment -Name "AzSentinel-Cloud-Monitoring-Initiative" -ManagementGroupId "<MGID>" -TemplateFile .\ARM-Template json -Location 'UAE North' -Verbose
- Once successful, you will be able to see the initiative showing under Azure policy as per the below snapshot
- Assign the initiative specifying the scope (resource group or full subscription) and Log Analytics workspace of Microsoft Sentinel
- Wait for 20-30 mins till the assignment takes effect and start evaluating the compliance of resources.
- At this point the policy will ensure all new resources are deployed with the diagnostic settings pointing to the Microsoft Sentinel workspace, however existing resources will need remediation tasks to be created.
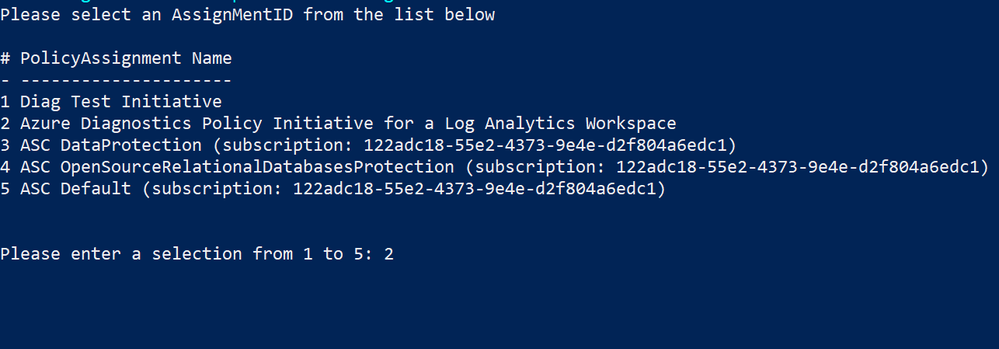
- To trigger bulk remediation tasks on all resources within a specific subscription, run the provided in the Github repository mentioned in the prerequisites section (after changing the “ww” extension to “ps1”), select the subscription and the Azure diagnostics policy initiative created in the previous step, then the script will automatically create several remediation tasks for all resources under the selected subscription according to the assignment scope per below:
- Finally, perform a review, checking for any unsuccessful remediation tasks, to ensure that diagnostic settings are well remediated, if any are missing, it can be manually remediated.
After configuring the diagnostic logs for the IaaS and PaaS resources, we can now use Microsoft Sentinel to begin addressing a range of detection and response use cases. Next, we highlight sample use-cases based on out-of-the box rule templates as well as two custom ones.
Analytics rules
There are several out-of-the-box analytics rules that can be enabled to fulfil the below use cases
1- Correlation of IP address with threat intelligence to detect threat actors
2- Detecting Log4J exploitation artifacts
3- Detecting malicious web requests to web apps
4- Detecting critical ports being opened to internet on Azure resources
5- Azure Key vault mass secret exfiltration events
6- Azure Key vault sensitive operations anomaly
7- SQL queries that took long execution time
8- Detection of Boolean blind SQL injection attacks
Sample custom detection rules
9- Azure Storage use case
- Detection of data exfiltration activities from Azure storage accounts and data lakes, based on anomaly detection mechanism:
let starttime = 14d;
let endtime = 1d;
let timeframe = 1h;
let scorethreshold = 1.5;
let percentthreshold = 50;
let TimeSeriesData =
StorageFileLogs
| where TimeGenerated  between (startofday(ago(starttime))..startofday(ago(endtime)))
| where OperationName == "GetFile"
| project TimeGenerated, OperationName, Uri
| make-series Total=count() on TimeGenerated from startofday(ago(starttime)) to startofday(ago(endtime)) step timeframe;
let TimeSeriesAlerts = TimeSeriesData
| extend (anomalies, score, baseline) = series_decompose_anomalies(Total, scorethreshold, -1, 'linefit')
| mv-expand Total to typeof(double), TimeGenerated to typeof(datetime), anomalies to typeof(double), score to typeof(double), baseline to typeof(long)
| where anomalies > 0
| project TimeGenerated, Total, baseline, anomalies, score;
TimeSeriesAlerts | where TimeGenerated > ago(2d)
| join (StorageFileLogs
    | where TimeGenerated > ago(2d)
    | extend DateHour = bin(TimeGenerated, 1h)
    | where OperationName == "GetFile"
    | summarize HourlyCount=count(), TimeGeneratedMax = arg_max(TimeGenerated, *), SourceIPMax= arg_max(CallerIpAddress, *) by Uri, OperationName, TenantId, TimeGenerated = bin(TimeGenerated, 1h)
    | where HourlyCount > 20 // Only considering operations with more than 20 hourly count to reduce False Positivies
    | order by HourlyCount desc
) on TimeGenerated
// Optional watchlist line below can be added to contain the most senstive storage accounts to reduce noise
//| lookup kind=inner _GetWatchlist('<Your Watchlist Name>') on $left.AccountName == $right.SearchKey
| extend PercentofTotal = round(HourlyCount/Total, 2) * 100
| where PercentofTotal > percentthreshold // Filter Users with count of less than 50 percent of TotalEvents per Hour to remove FPs/ users with very low count of GetFile events
| order by PercentofTotal desc
| project-reorder TimeGeneratedMax, OperationName, SourceIPMax , HourlyCount, PercentofTotal, Total, baseline, score, anomalies
You can also enrich this query logic by limiting its context to contents of specific Watchlist items as described in this blog: Common scenarios using Watchlists (with query examples)! - Microsoft Tech Community
From the Analytics blade in Microsoft Sentinel, create a new scheduled rule
Paste the KQL query above into the “Set rule logic” section after providing a name for your custom rule
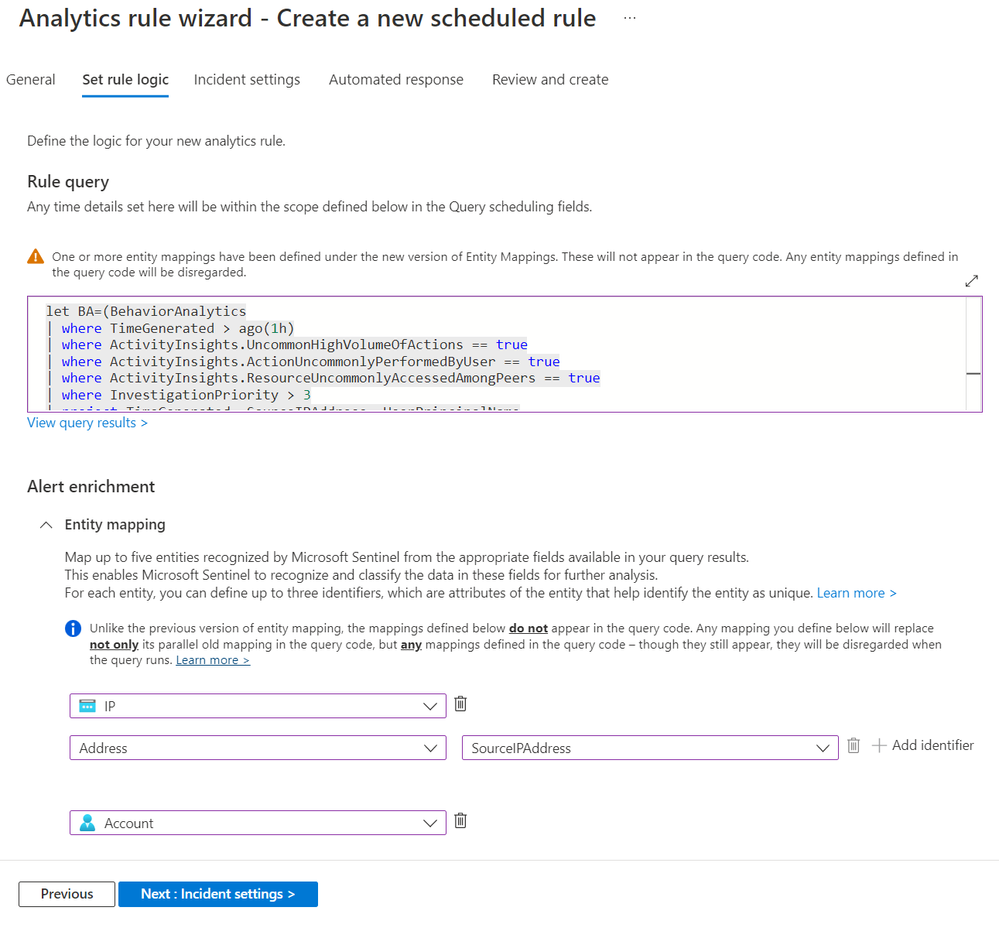
Ensure to map the IP and Account fields as shown above.
Automation Playbooks
In terms of response to this incident we would like to perform three related interventions:
- Block IP - Azure Firewall IP groups
- Enrichment - Virus Total report
- Send email with formatted incident report
Attach the 3 playbooks to the analytics rule via an Automation rule:
10 - Azure Kubernetes use case
- Detection of suspicious access and activities against an Azure Kubernetes cluster
This use-case requires that the UEBA solution be enabled in addition to the diagnostic logs being collected as covered in the on-boarding section of the blog
let lookback=1h;
let BA=(BehaviorAnalytics
| where TimeGenerated > ago(lookback)
| where ActivityInsights.UncommonHighVolumeOfActions == true
| where ActivityInsights.ActionUncommonlyPerformedByUser == true
| where ActivityInsights.ResourceUncommonlyAccessedAmongPeers == true
| where InvestigationPriority > 3
| project TimeGenerated, SourceIPAddress, UserPrincipalName
| where isnotempty( SourceIPAddress));
BA
| join (AzureDiagnostics
| where TimeGenerated > ago(lookback)
| where Category == "kube-audit" or Category == "kube-audit-admin"
| extend SrcIP= tostring(parse_json(tostring(parse_json(log_s).sourceIPs))[0])) on $left.SourceIPAddress == $right.SrcIP //extract source IP from Azure Diagnostics logs
| project TimeGenerated, SourceIPAddress, UserPrincipalName,Environment_s
Note: You can take advantage of the normalized events in the BehaviorAnlaytics table to refine granularity of detections you would like to make.
From the Analytics blade in Microsoft Sentinel, create a new scheduled rule
Paste the KQL query above into the “Set rule logic” section after providing a name for your custom rule
Ensure to map the IP and Account fields as shown above.
Automation Playbooks
In terms of automated responses to this incident we would like to perform three related interventions actioned via the playbooks below:
- Block the source IP in our Palo Alto firewall
- Block the IP in Microsoft Defender for Endpoint
- Block the user in Azure AD that was performing the suspicious actions
Attach the 3 playbooks to the Analytics rule
Workbooks
After enabling the analytics rules, multiple workbooks can be activated to monitor events and activities related to the onboarded Azure IaaS and PaaS. Below are suggested samples
- Azure Kubernetes Services Workbook
- Azure Firewall Workbook
- Azure Key Vault Workbook
- Azure DDOS Workbook (If DDOS Standard service is enabled for those resources)
- Azure Web Application Firewall Workbooks
Automation Playbooks
As the defined analytics rules begin to trigger alerts, we can expect to see incidents being generated within Microsoft Sentinel. Automation playbooks associated with the analytics rules will trigger to perform the designated activities, as provided in the above examples. You can also run one or more playbooks on demand as part of investigation and response as detailed in this blog post : What's new: run playbooks on incidents on demand - Microsoft Tech Community
Additional resources
Overview of Azure Policy - Azure Policy | Microsoft Docs
Exploring Anomalies with Log Analytics using KQL - Microsoft Tech Community
Together we can make the world a safer place -:)
You must be a registered user to add a comment. If you've already registered, sign in. Otherwise, register and sign in.


