- Home
- Security, Compliance, and Identity
- Microsoft Defender for IoT
- Take Azure Defender for IoT for a Spin
Take Azure Defender for IoT for a Spin
- Subscribe to RSS Feed
- Mark Discussion as New
- Mark Discussion as Read
- Pin this Discussion for Current User
- Bookmark
- Subscribe
- Printer Friendly Page
- Mark as New
- Bookmark
- Subscribe
- Mute
- Subscribe to RSS Feed
- Permalink
- Report Inappropriate Content
Oct 22 2020 06:18 AM - last edited on Nov 30 2021 08:25 AM by Allen
Intended audience: Security and OT engineering enthusiasts, looking to secure unmanaged critical networks used by IoT/OT devices such as Building Management Systems, Manufacturing, Critical Infrastructure and more!
Introduction
You’ve read the product materials and would like to get started with securing your IoT/OT network – in this blog post, we will focus on setting up a sensor on your critical networks - without impacting IoT/OT stability or performance (If you missed it, you can read more about the capabilities of Azure Defender for IoT here).
The goal of this article is to guide you through setting up a sensor to demonstrate the value of the system, as well as a quick start for securing unmanaged IoT/OT devices.
Try it now at no charge
Try Azure Defender for IoT - This version includes the agentless security provided via the integration of CyberX, a Microsoft company, plus the ability to connect to Azure Sentinel.
Preparing your environment
Azure Defender for IoT monitors unmanaged devices that are used in Operational Technology (OT) environments such as manufacturing, building management systems (BMS), life sciences, energy and water utilities, oil & gas, and logistics.
In the most basic configuration, Setting up your environment can be taken in 4 easy steps:
1. Setup a sensor
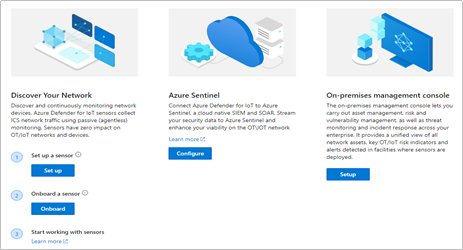
The software for the sensor may be installed on physical servers or as a virtual machine. The sensor installation files can be downloaded from the Azure Defender for IoT portal, on the “Getting Started” -> “Network Sensor” tab.
- Log into your Azure Account and download the ISO installer for the sensor.
- Install the ISO from USB on a VM or physical server (see Hardware Guide and Installation Guide)
- Make sure to make a note of the administrative login credentials presented during the installation process.
- If your setup includes multiple sensors, you can also download the optional “On-Premises Management Console” which allows you to manage and monitor large sensor deployments. More on this in the Installation Guide, Chapter 8
2. Monitor a SPAN port
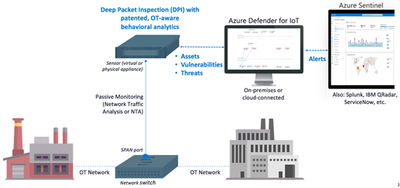
The sensor implements non-invasive passive monitoring with Network Traffic Analysis (NTA) and Layer 7 Deep Packet Inspection (DPI) to extract detailed IoT/OT information in real-time, even across diverse automation equipment from all major OT suppliers such as: Rockwell Automation, Schneider Electric, GE, Emerson, Siemens, Honeywell, ABB, Yokogawa, etc.
Locate a managed LAN switch connected to IoT/OT devices. These switches can typically be set up with monitoring ports (also called SPAN or mirror ports).
Utilizing this technique, the sensor will passively monitor the OT network, without creating any traffic which might impact or risk devices on the network.
Connect the monitoring port to the sensor’s monitoring interface (typically the first available ethernet card)
For more information and configuration examples, see the Network Deployment Guide, Chapter 5 - “Traffic Monitoring.”
3. Register and Activate the Sensor
Once the sensor has been connected to the monitor port – it will immediately begin to analyze the network traffic. The next step is to login to the sensor and activate it with an activation file available for your account, in the Azure Defender for IoT portal.
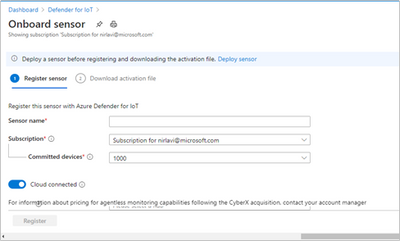
- Log into your Azure Account select the “Onboard” sensor button (underlined below):
- Next, fill in the sensor name and subscription details.
- The button for "cloud-connected" will optionally send alert information into IoT Hub and Sentinel for further analysis.
- If you have an air-gapped or completely on-premises implementation with no connection to the cloud, disable the "cloud-connected" button below before you generate your license.
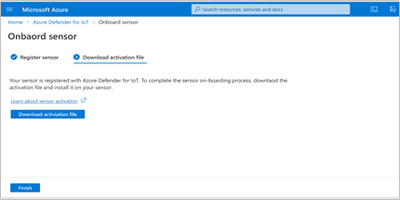
- Download the activation file. This will be used in the next step to activate the sensor.
- Login to the sensor’s IP address, with the administrative credentials shown during the installation process.
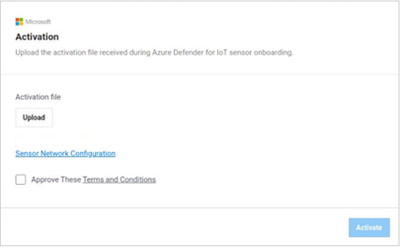
- On the next screen – upload the activation file from the previous step.
- For more information and detailed steps, see the Onboarding Guide.
4. Start Exploring
Now you’ve successfully installed your first sensor and you can start using the system – view the asset inventory, zoom in on the network map or generate a risk report.
Conclusion
Thank you for reading this blog post. There will be more blog posts to follow, which will enable you to get the best of out your system, which will include: what to do when malware is detected, connecting to Azure Sentinel, or simulating attack vectors, so please check back with us soon.
Learn more with these educational resources:
- Watch our Ignite session showing how Azure Defender for IoT and Azure Sentinel are combined to investigate multistage attacks that cross IT/OT boundaries, using the TRITON attack on a petrochemical facility as an example.
- Watch our Tech Community webinar describing MITRE ATT&CK for ICS, an OT-focused version of the well-known MITRE ATT&CK framework originally developed for IT networks.
- Watch our SANS webinar featuring the head of Microsoft’s datacenter security program, about securing building automation systems using continuous OT security monitoring.
- Stay tuned for an upcoming webinar during which we’ll do a technical walkthrough of how to deploy and use Azure Defender for IoT.
Troubleshooting
- No traffic is monitored on the sensor.
- Check that the monitoring port is connected to the correct ethernet port.
- Make sure the port is indeed a SPAN port by monitoring bandwidth on the port.
- For more troubleshooting, see the Network Setup Guide, Appendix 1
- I cannot find a device in the Asset Inventory
- Make sure the device is connected to the network.
- Search for its MAC address in the Asset Inventory – if it is active, it will appear on the list.
