- Home
- Security, Compliance, and Identity
- Microsoft Defender for IoT Blog
- Investigating an Alert Using Defender for IoT and Wireshark
- Subscribe to RSS Feed
- Mark as New
- Mark as Read
- Bookmark
- Subscribe
- Printer Friendly Page
- Report Inappropriate Content
This blog will be one in a series of blogs to discuss the above topic. We will take specific Microsoft Defender for IoT alerts and try to understand what initiated the alert and if the issue is one needing further investigation or remediation or not. We will follow a basic sequence to start the analysis. This initial sequence will be used for all the investigations.
As the blog progresses, if you have an alert of concern and you are willing to provide a pcap, we can follow this process for your alert. Any examples used would be scrubbed and addresses anonymized.
The sequence is below:
- Review type of alert to understand the cause for concern
- Utilize properties in Devices Map to determine if the device has multiple alerts
- Utilize data mining to determine what types of conversations the suspect device has had
- Make note of specific IP / MAC addresses involved
- Determine protocol(s) involved
- Load pcap file into Wireshark, Determine if protocol in question is identified in Wireshark https://wiki.wireshark.org/, Filter traffic on IP / MAC Addresses involved in alert
- Follow interesting streams. These can be determined by by looking at Statistics – Protocol Hierarchy, then Statistics – Flow Graph
- Note any meaningful text in message flow
- Use statistics – conversations – limit to display filter: to see what other conversations are initiated from suspect source
- Apply interesting conversations as filter
- Look for internet or DMZ sessions with the suspect address(es)
- Look for file transfer to/from suspect address(es) over SMB, FTP, SFTP, FTPS, SCP, HTTP, HTTPS, etc.
- Look for remote access to target from internet or DMZ address(es), could be RDP, VNC, SSH, ..
- Look for illegal command messages
- Look for scanning activities
- If the activity appears to be malicious, attempt to place it in Att&ck for ICS framework
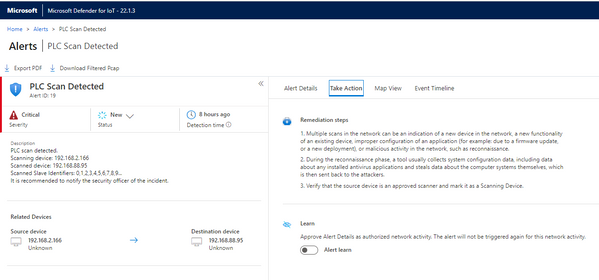
Alert: PLC Scan Detected
- As described in the alert, this activity could be normal or it could be malicious. Some ICSs routinely scan all active devices to determine if they are functional and communicating. So how do we evaluate this specific alert? Let’s follow the sequence…
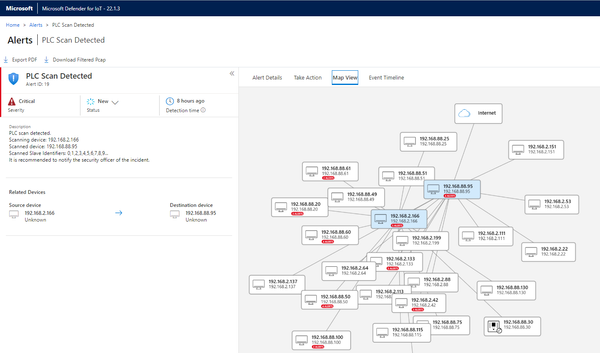
- Now let’s look at this scanning device in the Devices Map to see if it has multiple alerts like this one.
Notice that there seem to be two devices involved with 192.168.2.166 being the initiator. We might filter on this IP address in the Alerts list to see if all the alerts are related to scanning.
There are three different types of alerts associated with this source address.
- At this point, we will use the Device Map to see what types of communication are common to this host. Shown on the right is the details form showing all protocols associated with this IP address. Below, the plausibility of malicious activity appears more likely as we can see that the client 192.168.2.166 appears to attempt connections on a variety of protocols to target machines.
- Making note of the specific IP addresses involved, we see a range of addresses all on the 192.168.88.0 subnet, including the address in our alert.
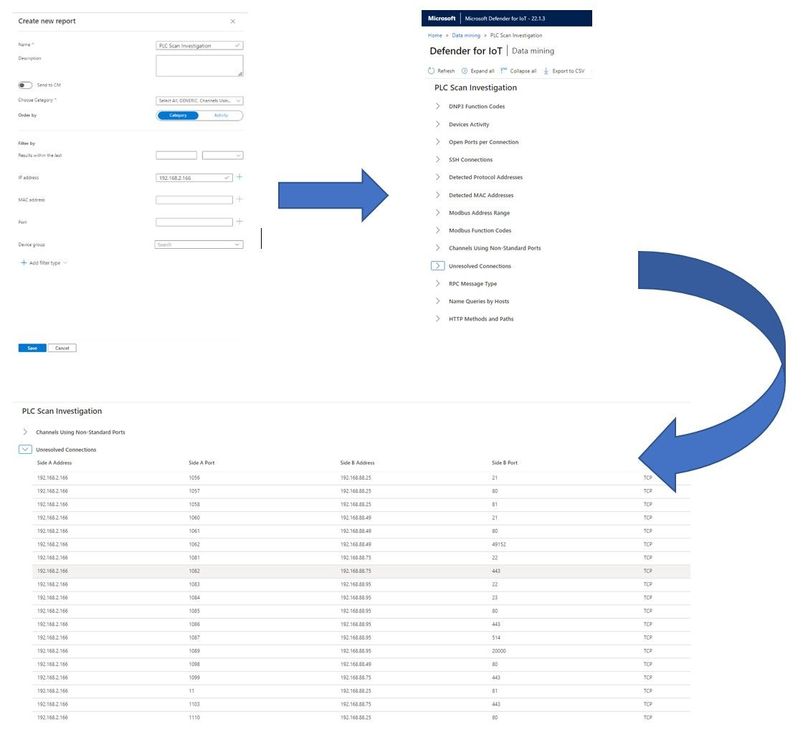
- Next, defining a Data Mining report to see all communications from 192.168.2.166 on all protocols makes the case even stronger. Looking at the unresolved connections shows that this machine is poking a number of other machines on a variety of well known ports.
Well known protocols used include 21 (FTP), 22 (SSH), 23 (Telnet), 80 (HTTP), 135 (RPC Endpoint Mapper), 443 (HTTPS), 514 (Remote Shell), 4000 (Emerson ROC), 7001 (SPA), and 20000 (DNP3) among others.
6. Microsoft Defender for IoT makes the filtered pcap available for this alert. Loading the filtered pcap into Wireshark, found many attempted sessions followed either by RST, ACK or by Fin, ACK. This pcap showed only scans targeting 192.168.88.60
7. Follow the streams associated with the identified protocols
Use filters in Wireshark to select each protocol, for instance tcp.port==21. This shows that there is one FTP attempt and it receives a RST/ACK. See below…
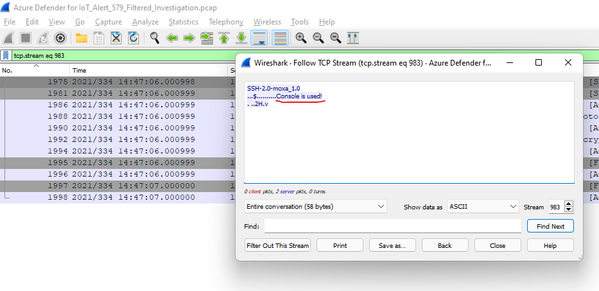
Going on to the next protocol, SSH is a little more interesting. The filter is tcp.port==22. If you note the ‘[‘ lines to the left of the packet window, this is a way to see the packets involved in the various streams. I look for a ‘meaty’ stream (having a number of related packets) and follow the stream.
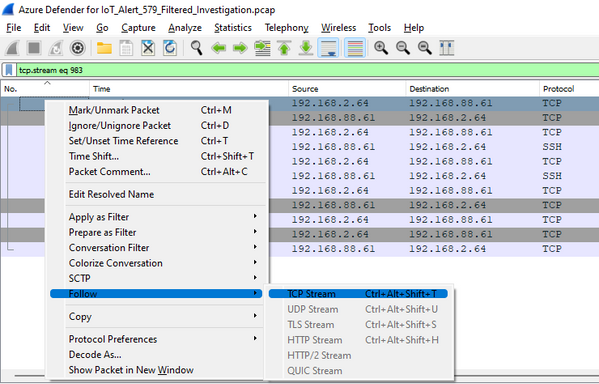
To follow the stream, right-click on the starting packet (or any packet in the stream), select ‘Follow’, then ‘TCP Stream’ as shown below:
Note that this shows a console attempt over SSH to a MOXA switch.
Moving on to Telnet on port 23 and adding one more Wireshark method, we will first filter on port 23 with tcp.port==23 to show this filtered data.
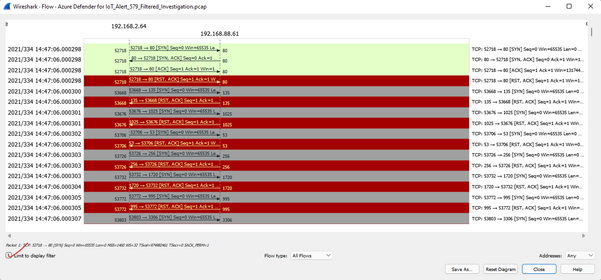
Now we will utilize the Statistics – Flow Graph option to look at this data in a different way.
The result shows all streams as seen below:
Check the box to Limit the Flow Graph to the selection in the main window to tcp port 23, and the Flow Graph now shows only traffic involving Telnet below.
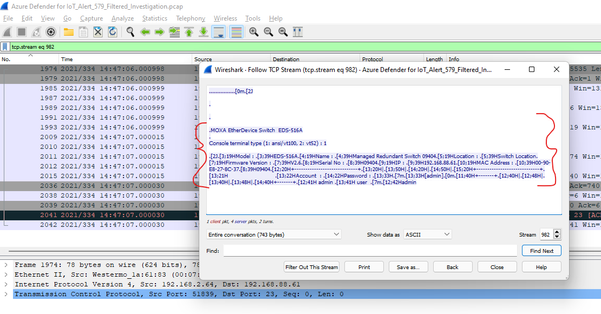
This shows some actual data passing as shown. Since this data is in plain text, we want to see what is flowing in this stream. Clicking on any line in this Flow Graph highlights the associated packet in the main Wireshark display in the background. And from here we can follow the stream as we did above. This results in the following…
Now, this is really interesting. This query yields some potentially important information tabulated below.
- MOXA EtherDevice Switch EDS-516A (Switch Model)
- It is a Managed Redundant Switch
- Firmware Version 2.6
- S/N 09404
- IP 192.168.88.61
- MAC 00-90-E8-27-8C-37
- Existence of an account named: admin
- Existence of a user account: user, possible password: Hadmin
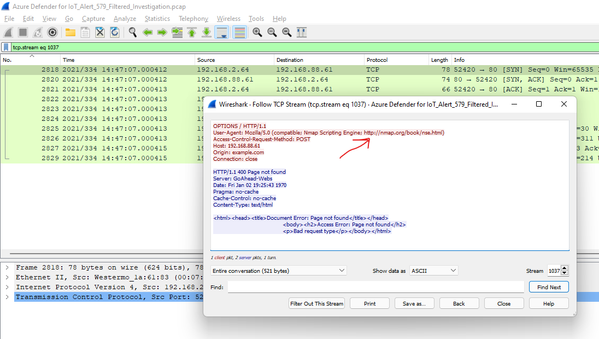
Following a similar process for HTTP yields an attempt to determine if the host 192.168.88.61 supports the http POST method.
No similar success was found in any of the other ports with exception of 4000 and 4001. These yielded a ‘JDWP – Handshake’ followed by some binary then ‘J.WP’. Not sure what this means but is related to Emerson ROC.
So, to summarize, Microsoft Defender for IoT identified a potential issue on this network. We used some of its inherent tools to decide if the alert appears to be a real concern. Then we used Wireshark to gain insight into what information the potential attacker may have learned about the devices on this network.
This provides us insight into how to defend this network, by preventing this type of access, possibly via firewall rule improvement. We can certainly change passwords on scanned devices. We can eliminate, if possible, open text communication modes like ftp or build up secondary defenses if this is not possible.
Hope you enjoyed this!
You must be a registered user to add a comment. If you've already registered, sign in. Otherwise, register and sign in.
