- Home
- Security, Compliance, and Identity
- Microsoft Defender for Endpoint Blog
- New! Windows Defender ATP Incidents narrate the end-to-end attack story
- Subscribe to RSS Feed
- Mark as New
- Mark as Read
- Bookmark
- Subscribe
- Printer Friendly Page
- Report Inappropriate Content
Ever heard security analysts complain: “we don’t receive enough alerts”? No? Neither have we. We did hear them ask for better alert handling, alert context, and alert prioritization. Alerts rarely come in isolation. As attacks become more complex and multi-staged, detection capabilities expand resulting in multiple individual alerts being raised in a security team's queue. As a result, security analysts are faced with the challenge of reconstructing the story of an attack by identifying and piecing together all related alerts and artifacts across all the impacted machines to find the correlation of it all across the entire timeline of the attack. We are here to help. To address this and make investigations easier and more efficient, we are introducing incidents.
Incident is a new entity in Windows Defender ATP that brings together all relevant alerts and related entities to narrate the broader attack story, giving analysts better perspective on the purview of complex threats. The new Incident queue in Windows Defender ATP now provides security teams with a higher fidelity, lower noise, more comprehensive entry point to attack investigations; effectively reducing load and effort required to investigate and respond to attacks.
With incidents Windows Defender ATP can now help analysts by automatically grouping alerts, underlying evidence, as well as automated investigation cases into a single over-arching entity. Windows Defender ATP generates a single inventory view for all above entities and generates a graphical representation of the evidence via the new attack graph. Using Incidents, analysts can save precious time spent on data correlation and gain better understanding of the story of the attack. Aggregation of alerts and its entities is fully automatic using predefined heuristics. Analysts can also manually link additional alerts into an incident or edit existing correlations to split existing incidents.
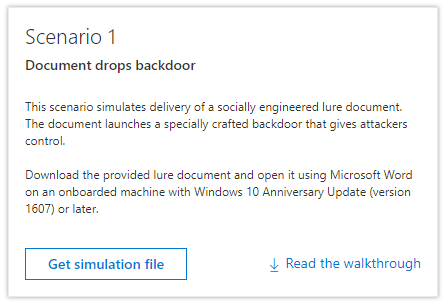
Let’s look at one such incident as it reflects through one of our do-it-yourself (DIY) attack scenarios.
|
We encourage you to run this attack demo script on your own Windows Defender ATP instance to test drive the new Incident capability – Ensure ‘preview features’ enabled for your tenant and go to the tutorial section of your Windows Defender ATP portal and run Scenario #1 ‘Document drops backdoor’. |
|
After running the simulation, we now go to the new Incidents queue (new symbol in the left-side navigation bar) and pick the incident created as a result of running the DIY scenario from the queue. A side panel will display additional information about the incident, including all related alerts.

Select Open incident page to get more information about the incident.
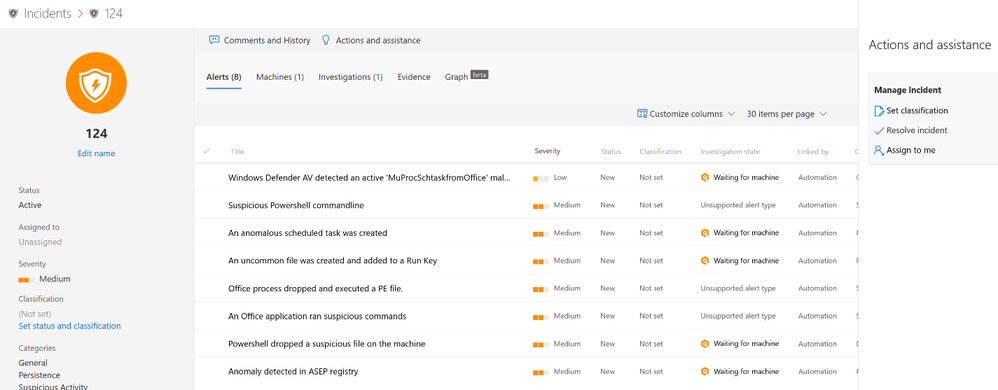
Reviewing the incident alert list shows how the progression of the attack unfolds. From this view you can dive into each individual alert.

To understand how the incident was formed, you can investigate each alert and see how they were linked together. Alerts are grouped into incidents based on the following correlations:
- Proximate time - The alerts were triggered on the same machine within a certain timeframe
- Same file - The files associated with the alert are exactly the same
- File characteristics - The files associated with the alert have similar structure and form a cluster
- Automated investigation - The automated investigation process linked the alerts
- Manual association - A user manually linked the alerts
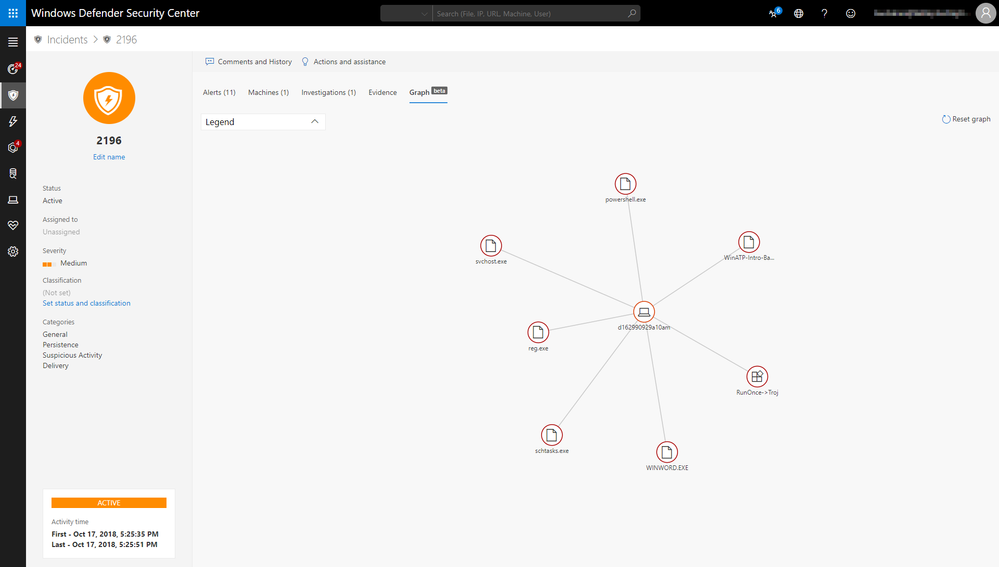
In the incident page, you can view all the affected machines, related alerts, entities (evidence) and ongoing automated investigations and remediations. For a broader view of the entities involved in the incident, select Graph.

In the incident graph, you can click on each entity to view more in-depth details. For example, the file entity will show associated file detections, identify how many instances of the file were seen worldwide, and how many instances were observed in your own organization.
After you complete the investigation and resolve the incident, you can close the entire incident and all related alerts by selecting Actions and assistance on the incident page.

Take a moment to try out the new incident capability by going to the Windows Defender Security Center to experience a whole new way of conducting alert investigations.
Windows Defender ATP Team
You must be a registered user to add a comment. If you've already registered, sign in. Otherwise, register and sign in.

