- Home
- Security, Compliance, and Identity
- Microsoft Defender for Endpoint Blog
- Getting Started with Windows Defender ATP Advanced Hunting
- Subscribe to RSS Feed
- Mark as New
- Mark as Read
- Bookmark
- Subscribe
- Printer Friendly Page
- Report Inappropriate Content
We’ve recently released a capability called Advanced Hunting in Windows Defender ATP that allows you to get unfiltered access to the raw data inside your Windows Defender ATP tenant and proactively hunt for threats using a powerful search and query language.
Why should I care about Advanced Hunting?
There will be situations where you need to quickly determine if your organization is impacted by a threat that does not yet have pre-established indicators of compromise (IOC). Think of a new global outbreak, or a new waterhole technique which could have lured some of your end users, or a new 0-day exploit.
Imagine the following scenario.
It’s early morning and you just got to the office. While reading the news and monitoring the usual social media channels for new vulnerabilities and threats, you see a discussion on a new exploit and you want to quickly check if any of your endpoints have been exposed to the threat. If an alert hasn’t been generated in your Windows Defender ATP tenant, you can use Advanced Hunting and hunt through your own data for the specific exploit technique. Based on the results of your query, you’ll quickly be able to see relevant information and take swift action where needed.
How does Advanced Hunting work under the hood?
Advanced Hunting makes use of the Azure Kusto query language, which is the same language we use for Azure Log Analytics, and provides full access to raw data up to 30 days back.
The data model is simply made up by 10 tables in total, and all of the details on the fields of each table is available under our documentation, Advanced hunting reference in Windows Defender ATP.
- Alert information: This table includes information related to alerts and related IOCs
- Machine info: Includes properties of the devices (Name, OS platform and version, LoggedOn users, and others)
- Machine network info (Preview): The device network interfaces related information
- Process creation event: The process image file information, command line, and others
- Load image: The process and loaded module information
- Network communication events: The process and connection information
- File creation events: The created file info
- Registry activities: Which process change what key and which value
- LogOn event: Who logged on, type of logon, permissions, and others
- Events: A variety of Windows related events, for example telemetry from Windows Defender Exploit Guard
You can easily combine tables in your query or search across any available table combination of your own choice. Whatever is needed for you to hunt!
How do I write my first query?
The easiest way I found to teach someone Advanced Hunting is by comparing this capability with an Excel spreadsheet that you can pivot and apply filters on. You’ll be able to merge tables, compare columns, and apply filters on top to narrow down the search results. Advanced Hunting uses simple query language but powerful query language that returns a rich set of data.
Because of the richness of data, you will want to use filters wisely to reduce unnecessary noise into your analysis. The query language has plenty of useful operators, like the one that allows you to return up only a specific number of rows, which is useful to have for scenarios when you need a quick, performant, and focused set of results.
Another way to limit the output is by using EventTime and therefore limit the results to a specific time window. For more information, see Advanced Hunting query best practices.
Let’s take a closer look at this and get started. In our first example, we’ll use a table called ProcessCreationEvents and see what we can learn from there. First let’s look at the last 5 rows of ProcessCreationEvents and then let’s see what happens if instead of using the operator limit we use EventTime and filter for events that happened within the last hour.
ProcessCreationEvents
| limit 5
Image 1: Example query that returns random 5 rows of ProcessCreationEvents table, to quickly see some data
ProcessCreationEvents
| where EventTime > ago(1h)
Image 2: Example query that returns all events from ProcessCreationEvents table that happened within the last hour
Image 3: Outcome of ProcessCreationEvents with EventTime restriction
Now remember earlier I compared this with an Excel spreadsheet. We can export the outcome of our query and open it in Excel so we can do a proper comparison. As you can see in the following image, all the rows that I mentioned earlier are displayed.
Image 4: Exported outcome of ProcessCreationEvents with EventTime restriction which is started in Excel
As with any other Excel sheet, all you really need to understand is where, and how, to apply filters, to get the information you’re looking for. When you master it, you will master Advanced Hunting!
With that in mind, it’s time to learn a couple of more operators and make use of them inside a query.
How do I filter for specific activities?
There are several ways to apply filters for specific data. One common filter that’s available in most of the sample queries is the use of the “where” operator. This operator allows you to apply filters to a specific column within a table. For example, if you want to search for ProcessCreationEvents, where the FileName is powershell.exe. all you need to do is apply the operator in the following query:
ProcessCreationEvents
| where FileName == "powershell.exe"
Image 5: Example query that shows all ProcessCreationEvents where the FileName is powershell.exe
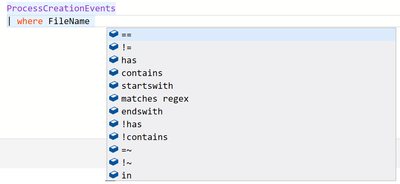
But remember you’ll want to either use the limit operator or the EventTime row as a filter to have the best results when running your query. Also note that sometimes you might not have the absolute filename or might be dealing with a malicious file that constantly changes names. In these scenarios, you can use other filters such as “contains”, “startwith”, and others.
Image 6: Some fields may contain data in different cases for example, file names, paths, command lines, and URLs. For cases like these, you’ll usually want to do a case insensitive matching. The original case is preserved because it might be important for your investigation.
ProcessCreationEvents
| where FileName =~ "powershell.exe"
| limit 5
Image 7: Example query that returns the last 5 rows of ProcessCreationEvents where FileName was powershell.exe. We are using =~ making sure it is case-insensitive.
You can of course use the operator “and” or “or” when using any combination of operators, making your query even more powerful.
ProcessCreationEvents
| where FileName =~ "powershell.exe"
or FileName =~ "cmd.exe"
| limit 5
Image 8: Example query that returns the last 5 rows of ProcessCreationEvents where FileName was powershell.exe or cmd.exe
In some instances, you might want to search for specific information across multiple tables. For that scenario, you can use the “find” operator. Think of the scenario where you are aware of a specific malicious file hash and you want to know details of that file hash across FileCreationEvents, ProcessCreationEvents, and NetworkCommunicatonEvents.
let fileHash = "e152f7ce2d3a4349ac583580c2caf8f72fac16ba";
find in (FileCreationEvents, ProcessCreationEvents, NetworkCommunicationEvents)
where SHA1 == fileHash or InitiatingProcessSHA1 == fileHash
project ComputerName, ActionType, FileName, EventTime
Image 9: Example query that searches for a specific file hash across multiple tables where the SHA1 equals to the file hash
How do I tailor the outcome of a query?
At some point, you may want to tailor the outcome of a query after running it so that you can see the most relevant information as quickly as possible. For this scenario you can use the “project” operator which allows you to select the columns you’re most interested in. Simply select which columns you want to visualize.
ProcessCreationEvents
| where FileName == "powershell.exe"
or FileName == "cmd.exe"
| limit 5
| project EventTime, ComputerName, ProcessCommandLine
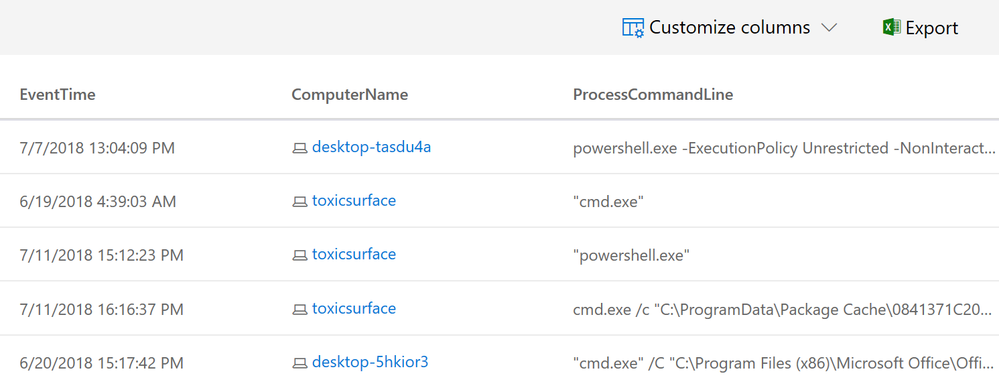
Image 10: Example query that returns the last 5 rows of ProcessCreationEvents where FileName was powershell.exe or cmd.exe, note this time we are using == which makes it case sensitive and where the outcome is filtered to show you EventTime, ComputerName and ProcessCommandLine
Image 11: Result of the previous query
There may be scenarios when you want to keep track of how many times a specific event happened on an endpoint. You can use the “summarize” operator for that, which allows you to produce a table that aggregates the content of the input table in combination with count() that will count the number of rows or dcount() that will count the distinct values.
ProcessCreationEvents
| where FileName == "powershell.exe"
| summarize count()
Image 12: Example query that searches for all ProcessCreationEvents where FileName was powershell.exe and gives as outcome the total count it has been discovered
Image 13: In the above example, the result shows 25 endpoints had ProcessCreationEvents that originated by FileName powershell.exe
ProcessCreationEvents
| where FileName == "powershell.exe"
| summarize dcount(ComputerName)
Image 14: Query that searches for all ProcessCreationEvents where FileName was powershell.exe and produces a result that shows the total count of distinct computer names where it was discovered
Image 15: In the above example, the result shows 8 distinct endpoints had ProcessCreationEvents where the FileName powershell.exe was seen
You might have noticed a filter icon within the Advanced Hunting console. This is a useful feature to further optimize your query by adding additional filters based on the current outcome of your existing query.
Image 16: select the filter option to further optimize your query
Image 17: Depending on the current outcome of your query the filter will show you the available filters.
Choosing the minus icon will exclude a certain attribute from the query while the addition icon will include it. Once you select any additional filters Run query turns blue and you will be able to run an updated query.
How do I join multiple tables in one query?
It almost feels like that there is an operator for anything you might want to do inside Advanced Hunting. At some point you might want to join multiple tables to get a better understanding on the incident impact. For that scenario, you can use the “join” operator.
FileCreationEvents
| where EventTime > ago(30d)
| project MachineId, FileName, SHA1, FolderPath
| join kind= inner (
	ProcessCreationEvents
	| where EventTime > ago(30d)
	| project MachineId, FileName, SHA1, FolderPath
) on MachineId, SHA1, FolderPath, FileName
| limit 10
Image 18: Example query that joins FileCreationEvents with ProcessCreationEvents where the result shows a full perspective on the files that got created and executed
This is particularly useful for instances where you want to hunt for occurrences where threat actors drop their payload and run it afterwards. This way you can correlate the data and don’t have to write and run two different queries.
Breakdown of some of the sample queries
PowerShell execution events that could involve downloads
This sample query searches for PowerShell activities that could indicate that the threat actor downloaded something from the network. Let’s break down the query to better understand how and why it is built in this way.
ProcessCreationEvents
| where EventTime > ago(7d)
| where FileName in~ ("powershell.exe", "powershell_ise.exe")
| where ProcessCommandLine has "Net.WebClient"
   or ProcessCommandLine has "DownloadFile"
   or ProcessCommandLine has "Invoke-WebRequest"
   or ProcessCommandLine has "Invoke-Shellcode"
   or ProcessCommandLine contains "http:"
| project EventTime, ComputerName, InitiatingProcessFileName, FileName, ProcessCommandLine
| top 100 by EventTime
Image 19: PowerShell execution events that could involve downloads sample query
|
ProcessCreationEvents |
Table selected |
|
| where EventTime > ago(7d) |
Only looking for events happened last 7 days |
|
| where FileName in~ (“powershell.exe”, “powershell_ise.exe”) |
Only looking for events where FileName is any of the mentioned PowerShell variations. Note because we use in ~ it is case-insensitive. |
|
| where ProcessCommandLine has "Net.WebClient" or ProcessCommandLine has "DownloadFile" or ProcessCommandLine has "Invoke-WebRequest" or ProcessCommandLine has "Invoke-Shellcode" or ProcessCommandLine has "http:" |
Only looking for PowerShell events where the used command line is any of the mentioned ones in the query |
|
| project EventTime, ComputerName, InitiatingProcessFileName, FileName, ProcessCommandLine |
Makes sure the outcome only shows EventTime, ComputerName, InitiatingProcessFileName, FileName and ProcessComandLine |
|
| top 100 by EventTime |
Ensures that the records are ordered by the top 100 of the EventTime |
Identifying Base64 decoded payload execution
It has become very common for threat actors to do a Base64 decoding on their malicious payload to hide their traps.
ProcessCreationEvents
| where EventTime > ago(14d)
| where ProcessCommandLine contains ".decode('base64')"
        or ProcessCommandLine contains "base64 --decode"
        or ProcessCommandLine contains ".decode64("
| project EventTime , ComputerName , FileName , FolderPath , ProcessCommandLine , InitiatingProcessCommandLine
| top 100 by EventTime
Image 20: Identifying Base64 decoded payload execution
|
ProcessCreationEvents |
Table selected |
|
| where EventTime > ago(14d) |
Only looking for events happened last 14 days |
|
| where ProcessCommandLine contains ".decode('base64')" or ProcessCommandLine contains "base64 --decode" or ProcessCommandLine contains ".decode64(" |
Only looking for events where the command line contains an indication for base64 decoding. -> .decode('base64') -> base64 –decode -> .decode64( |
|
| project EventTime , ComputerName , FileName , FolderPath , ProcessCommandLine , InitiatingProcessCommandLine |
Make sure that the outcome only shows EventTime , ComputerName , FileName , FolderPath , ProcessCommandLine , InitiatingProcessCommandLine |
|
| top 100 by EventTime |
Ensures that the records are ordered by the top 100 of the EventTime |
Identifying network connections to known Dofoil NameCoin servers
Dofoil is a sophisticated threat that attempted to install coin miner malware on hundreds of thousands of computers in March, 2018. The sample query below allows you to quickly determine if there’s been any network connections to known Dofoil NameCoin servers within the last 30 days from endpoints in your network.
NetworkCommunicationEvents
| where RemoteIP in ("139.59.208.246","130.255.73.90","31.3.135.232","52.174.55.168","185.121.177.177","185.121.177.53", "62.113.203.55","144.76.133.38","169.239.202.202","5.135.183.146","142.0.68.13","103.253.12.18", "62.112.8.85","69.164.196.21","107.150.40.234","162.211.64.20","217.12.210.54","89.18.27.34","193.183.98.154","51.255.167.0","91.121.155.13","87.98.175.85","185.97.7.7")
| project ComputerName, InitiatingProcessCreationTime, InitiatingProcessFileName, InitiatingProcessCommandLine, RemoteIP, RemotePort
Image 21: Identifying network connections to known Dofoil NameCoin servers
|
NetworkCommunicationEvents |
Table selected |
|
| where RemoteIP in ("139.59.208.246","130.255.73.90","31.3.135.232", "52.174.55.168", "185.121.177.177","185.121.177.53","62.113.203.55", "144.76.133.38","169.239.202.202","5.135.183.146", "142.0.68.13","103.253.12.18","62.112.8.85", "69.164.196.21" ,"107.150.40.234","162.211.64.20","217.12.210.54" ,"89.18.27.34","193.183.98.154","51.255.167.0" ,"91.121.155.13","87.98.175.85","185.97.7.7") |
Only looking for network connection where the RemoteIP is any of the mentioned ones in the query |
|
| project ComputerName, InitiatingProcessCreationTime, InitiatingProcessFileName, InitiatingProcessCommandLine, RemoteIP, RemotePort |
Makes sure the outcome only shows ComputerName, InitiatingProcessCreationTime, InitiatingProcessFileName, InitiatingProcessCommandLine, RemoteIP, RemotePort |
Knowledge Check
In the following sections, you’ll find a couple of queries that need to be fixed before they can work. Try to find the problem and address it so that the query can work. Don’t worry, there are some hints along the way.
NetworkCommunicationEvents
| where RemoteIP in (“msupdater.com”, “twitterdocs.com”)
| summarize by ComputerName, InitiatingProcessComandLine
22: This query should return a result that shows network communication to two URLs msupdater.com and twitterdocs.com
Image 23: This query should return a result that shows files downloaded through Microsoft Edge and returns the columns EventTime, ComputerName, InitiatingProcessFileName, FileName and FolderPath
How do I manage queries?
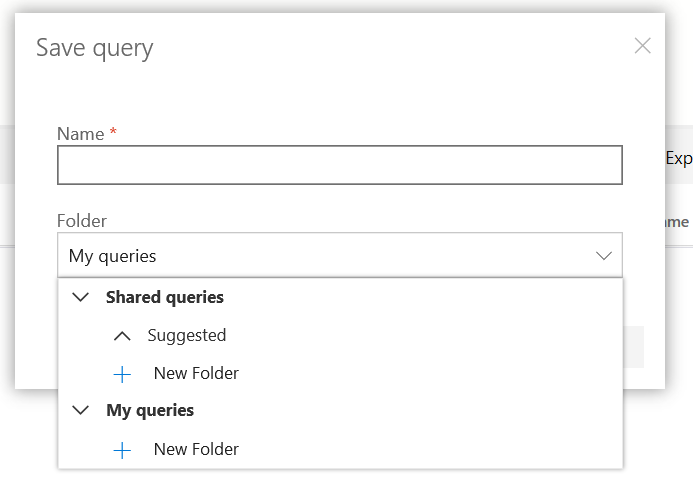
You might have some queries stored in various text files or have been copy-pasting them from here to Advanced Hunting. Advanced Hunting allows you to save your queries and share them within your tenant with your peers.
Image 24: You can choose Save or Save As to select a folder location
Image 25: Choose if you want the query to be shared across your organization or only available to you
Summary
We regularly publish new sample queries on GitHub. I highly recommend everyone to check these queries regularly. See, Sample queries for Advanced hunting in Windows Defender ATP.
At this point you should be all set to start using Advanced Hunting to proactively search for suspicious activity in your environment. If you have questions, feel free to reach me on my Twitter handle: @MiladMSFT.
You must be a registered user to add a comment. If you've already registered, sign in. Otherwise, register and sign in.


