- Home
- Internet of Things (IoT)
- Internet of Things Blog
- 7 ways new monitoring features help make your IoT Edge project successful
- Subscribe to RSS Feed
- Mark as New
- Mark as Read
- Bookmark
- Subscribe
- Printer Friendly Page
- Report Inappropriate Content
Monitoring and troubleshooting your Azure IoT Edge devices just became way simpler and efficient. We’re excited to launch the public preview of Azure IoT Edge monitoring solution with deep integration with Azure Monitor! Check out the IoT Show episode below for a guided tour of the new capabilities and get all the details from the docs site:
And now, without further ado here are 7 ways the solution can help make your IoT project successful and scale with confidence!
#1 Design the right architecture
Built-in metrics and curated visualizations enable you to quickly and easily analyze the efficiency of your solution. Measure metrics like message latencies and throughput; both between local modules and Upstream communication. Upstream can be ingestion into the Azure IoT cloud or the parent IoT Edge device in a nested configuration.
These insights help you choose optimal message sizes and compute placement (local vs. cloud vs. parent) to best address your scenario and manage cloud spend.
#2 Right-size edge hardware
Often you're left wondering how efficient your edge solution is at achieving its goals. Did I grossly over provision, leaving money on the table? or Am I running things too hot for comfort?
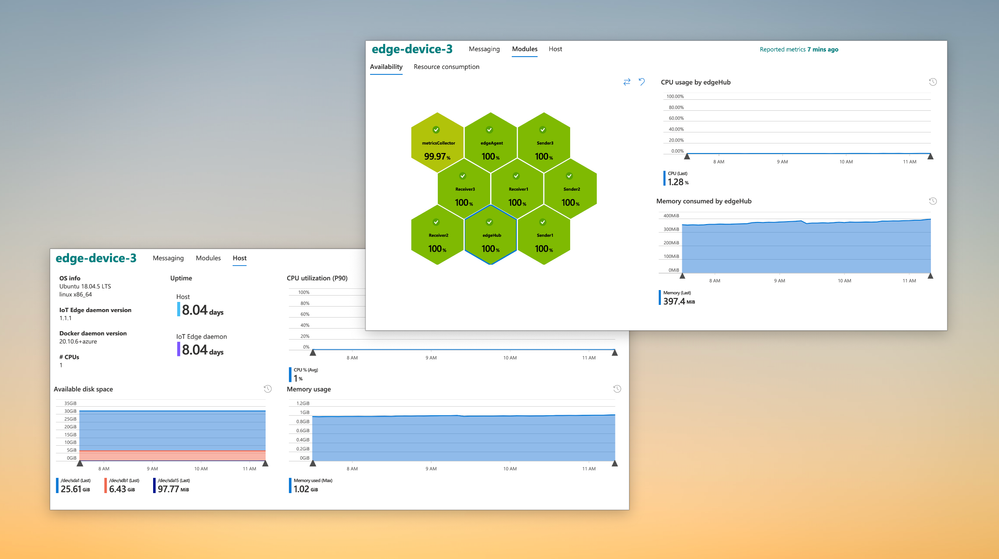
Take guess work out of the game and right-size your hardware by analyzing resource consumption data at both workload and host level.
#3 Create custom metrics and visualizations
While built-in metrics provide a lot out-of-the-box, you may need some scenario specific information to complete the picture. You can integrate information from custom modules and enhance the solution to cater to your unique needs.
Learn how easy it is to integrate custom metrics from the feature docs.
#4 Monitor locked down assets
In some scenarios, you edge device’s only window to the outside world is an Azure IoT endpoint. An example is a nested edge configuration where the lower level devices are completely locked down and can only communicate upstream with their parent IoT Edge device. Monitoring this critical edge infrastructure has been a challenge — until today!
The solution can be configured to transport metrics using IoT message telemetry path using the IoT Edge Hub. This path enables monitoring data from assets deep in your network to securely and seamlessly make its way up to the cloud, providing unprecedented observability.
To handle metrics data arriving at IoT Hub in the cloud, we’ve built an open source sample called IoT Edge Monitoring and Logging Solution (ELMS). ELMS lets you deploy a cloud workflow easily, even on existing resources to get started quickly.
#5 Unify cloud and edge monitoring
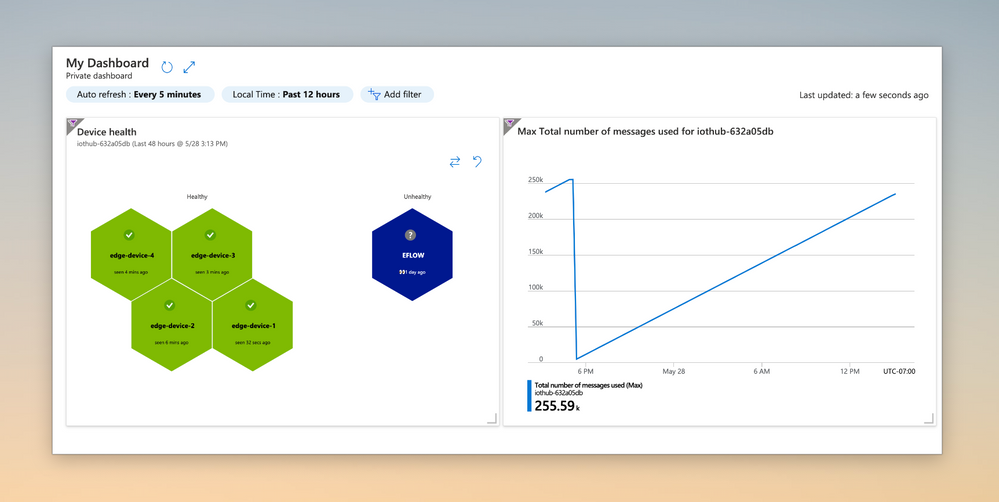
Azure Monitor Workbooks allow pinning visualizations, enabling your Ops teams to monitor both your edge and cloud resources with a unified dashboard. For example in the dashboard below the chart on the left is displaying the health of your IoT Edge devices, while the chart on the right is tracking the IoT Hub message quota usage:
#6 Monitor across resources with Alerts
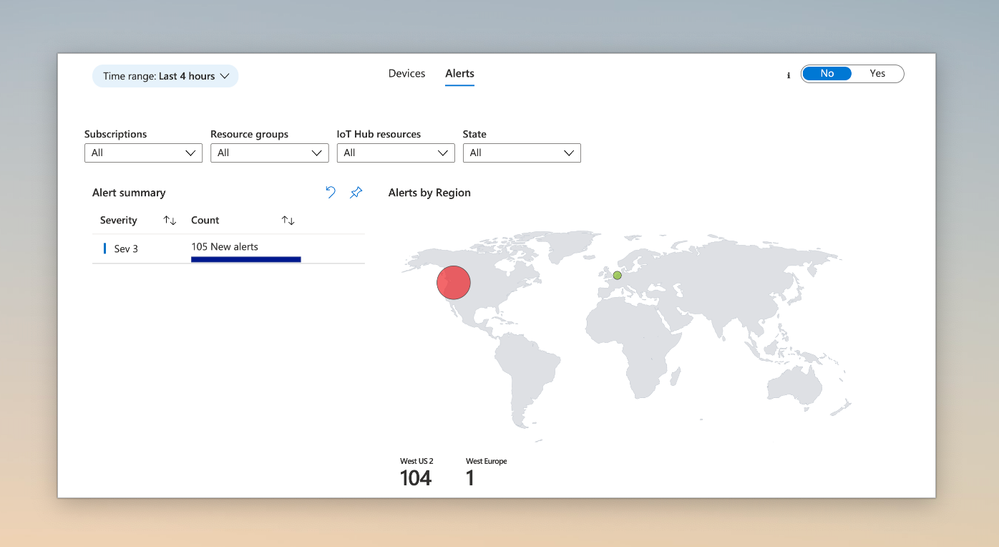
Azure Monitor Log Analytics allows you to create alert rules at a resource group or subscription level. These broadly-scoped alert rules can be used to monitor IoT Edge devices from multiple IoT Hubs. Use the ‘Alerts’ tab from the ‘IoT Edge Fleet View’ workbook to see alerts from multiple IoT Hubs at a glance.
#7 Rapidly and efficiently troubleshoot
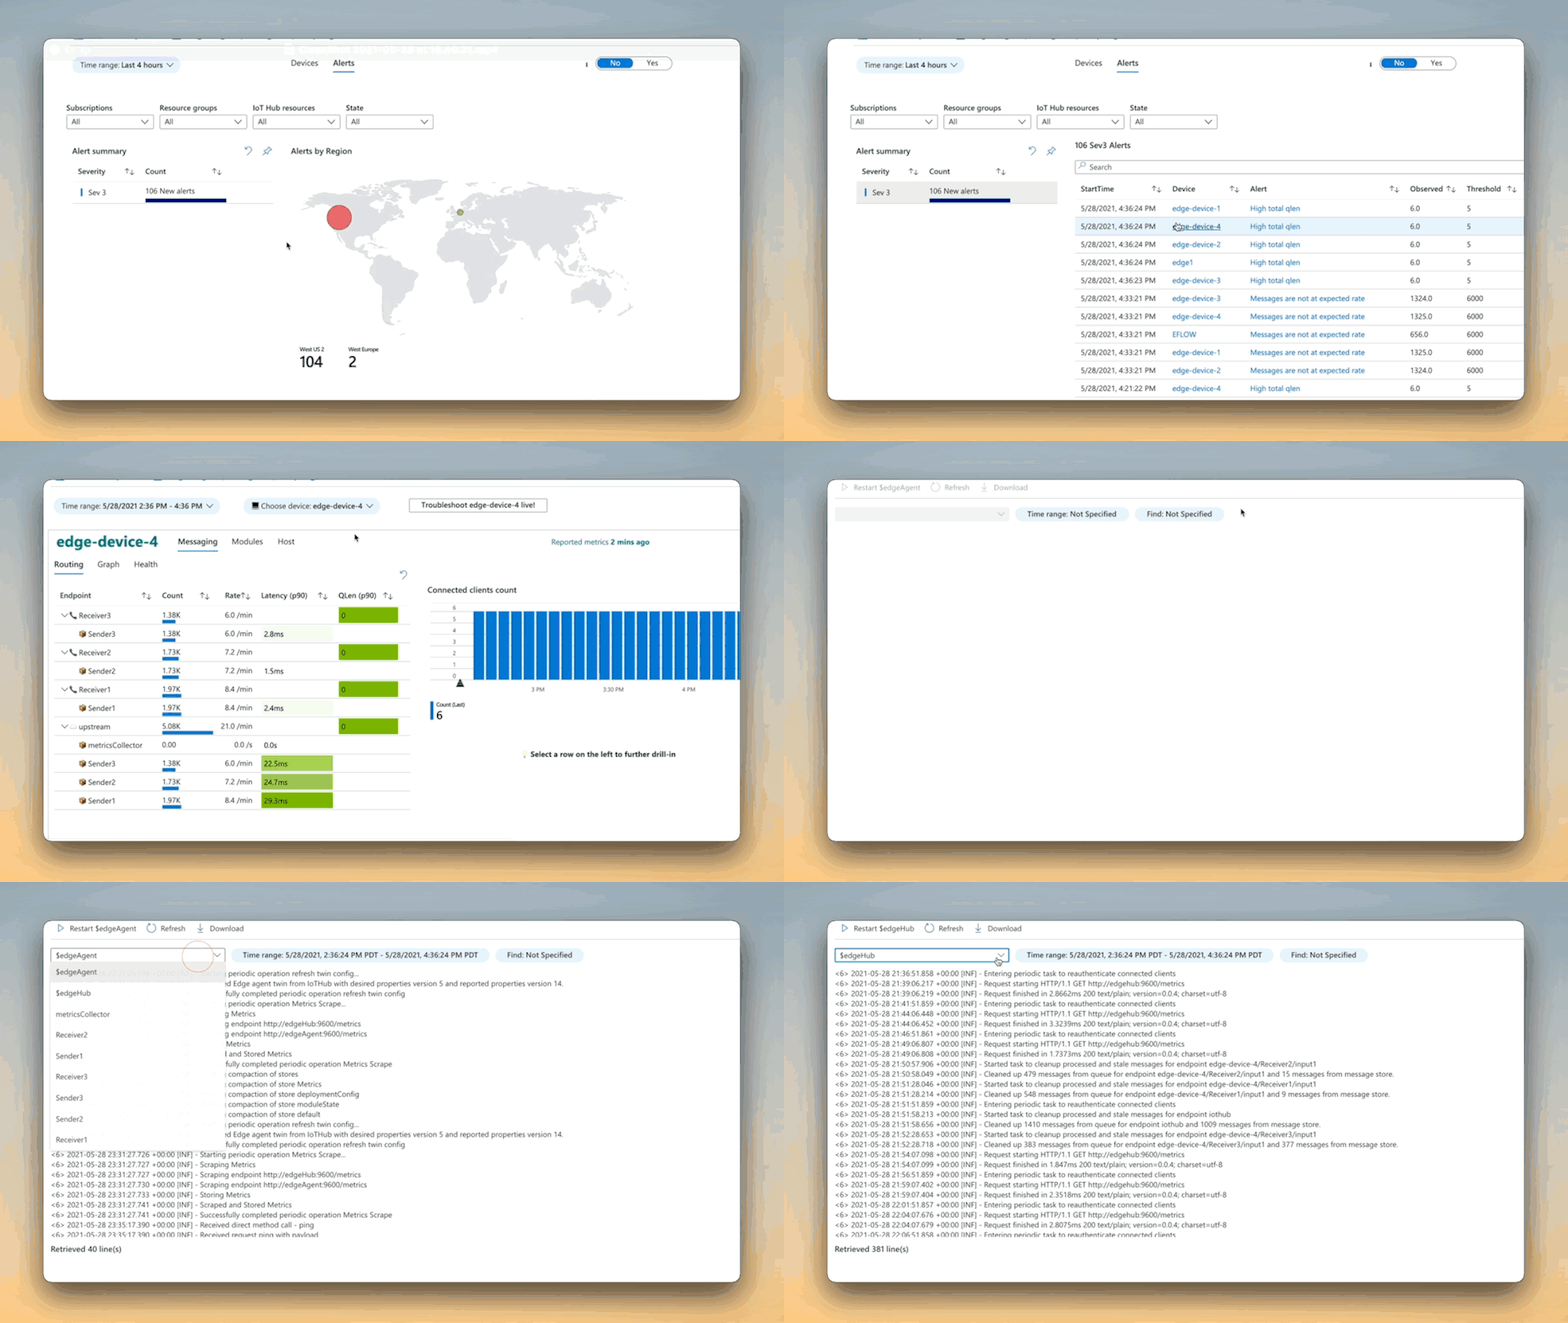
We’ve integrated the on-demand log pull feature of the IoT Edge runtime right into the Portal for quick and easy troubleshooting. If you enable metrics-based monitoring, the experience gets even better!
With just a couple of clicks, you can seamlessly move from reviewing device metrics in response to an alert firing to quickly pulling logs on-demand, automatically adjusted to the time range of interest.
Learn more
See the documentation for the detailed architecture, deployment steps, and more! We look forward to your feedback.
You must be a registered user to add a comment. If you've already registered, sign in. Otherwise, register and sign in.


