- Home
- Windows Server
- Failover Clustering
- Cluster Shared Volume Performance Counters
- Subscribe to RSS Feed
- Mark as New
- Mark as Read
- Bookmark
- Subscribe
- Printer Friendly Page
- Report Inappropriate Content
First published on MSDN on Jun 05, 2014
This is the third blog post in a series about Cluster Shared Volumes (CSV). In this post we will go over performance monitoring. We assume that reader is familiar with the previous blog posts. Blog post http://blogs.msdn.com/b/clustering/archive/2013/12/02/10473247.aspx explains CSV components and different CSV IO modes. Second blog post http://blogs.msdn.com/b/clustering/archive/2014/03/13/10507826.aspx explains tools that help you to understand why CSV volume uses one or another mode for IO.
Performance Counters
Now let’s look at the various performance counters which you can leverage to monitor what is happening with a CSV volume.
Physical Disks Performance Counters
These performance counters are not CSV specific. You can find “Physical Disk” performance counters on every node where disk is physically connected.
There are large number of good articles that describe how to use Physical Disk performance counters (for instance here http://blogs.technet.com/b/askcore/archive/2012/03/16/windows-performance-monitor-disk-counters-exp... ) so I am not going to spend much time explaining them. The most important consideration when looking at counters on a CSV is to keep in mind that values of the counters is not aggregated across nodes. For instance if one node tells you that “Avg. Disk Queue Length” is 10, and another tells you 5 then actual queue length on the disk is about 15. 
SMB Client and Server Performance Counters
CSV uses SMB to redirect traffic using File System Redirected IO or Block Level Redirected IO to the Coordinating node. Consequently SMB performance counters might be a valuable source of insight.
On the non-coordinating node you would want to use SMB Client Shares performance counters. Following blog post explains how to read these counters http://blogs.technet.com/b/josebda/archive/2012/11/19/windows-server-2012-file-server-tip-new-per-s... . 
On the coordinating node you can use SMB Server Shares performance counters that work in the similar way, and would allow you to monitor all the traffic that comes to the Coordinating node on the given share. 
To map the CSV volume to the hidden SMB share that CSV uses to redirect traffic you can run following command to find CSV volume ID:
PS C:\Windows\system32> Get-ClusterSharedVolume | fl *
Name : Cluster Disk 1
State : Online
OwnerNode : clus01
SharedVolumeInfo : {C:\ClusterStorage\Volume1}
Id : 6861be1f-bf50-4bdb-941d-0a2dd2a46711
CSV volume ID is also used as the SMB share name. As we’ve discussed in the previous post to get list of CSV hidden shares you can use Get-SmbShare. Starting from Windows Server 2012 R2 you also need to add -SmbInstance CSV parameter to that cmdlet to see CSV internal hidden shares. Here is an example:
PS C:\Windows\system32> Get-SmbShare -IncludeHidden -SmbInstance CSV
Name ScopeName Path Description
---- --------- ---- -----------
6861be1f-bf50-4bdb-941d-0a... * \\?\GLOBALROOT\Device\Hard ...
CSV$ * C:\ClusterStorage
All File System Redirected IO will be sent to the share named 6861be1f-bf50-4bdb-941d-0a2dd2a46711 on the Coordinating node. All the Block Level Redirected IO will be sent to the share CSV$ on the Coordinating node.
In case if you are using RDMA you can use SMB Direct Connection performance counters. For instance if you are wondering if RDMA is used you can simply look at these performance counters on client and on the server.
If you are using Scale Out File Server then SMB performance counters also will be helpful to monitor IO that comes from the clients to the SOFS and CSVFS.
Cluster CSV File System Performance Counters
CSVFS provides a large number of performance counters. Logically we can split these counters into 4 categories
- Redirected: All counters that start with prefix “Redirected” help you to monitor if IO is forwarded using File System Redirected IO and its performance. Please note that these counters do NOT include the IO that is forwarded using Block Redirected IO. These counters are based on measuring time from when IO was sent to SMB (if we are on non-Coordinating node) or to NTFS (if we are on Coordinating node) until this component completed the IO. It does not include the time this IO spent inside CSVFS. If we are on non-Coordinating node then the values you observe through these counters should be very close to the corresponding values you would see using SMB Client Share performance counters.
- IO: All counters that start with the prefix “IO” help you to monitor if IO is forwarded using Direct IO or Block Level Redirected IO and its performance. These counters are based on measuring time from when IO was sent to CSV Volume Manager until this component completed the IO. It does not include the time this IO spent inside CSVFS. If CSV Volume Manger does not forward any IO using Block Level Redirected IO path, but all the IO are dispatched using Direct IO then the values you will observe using these counters will be very close to what you would see using corresponding Physical Disk performance counters on this node.
- Volume: All counters that start with prefix “Volume” help you to monitor current CSVFS state and its history.
- Latency: All other counters help you to monitor how long IO took in CSVFS. This time includes how long the IO spend inside CSVFS waiting for its turn, as well as how long CSVFS was waiting for its completion from the underlying components. If IO is pause/resumed during failure handling then this time is also included.
This diagram demonstrates what is measured by the CSVFS performance counters on non-Coordinating node. 
As we've discussed before on non-Coordinating node File System Redirected IO and Block Redirected IO goes to SMB client. On Coordinating node you will see a similar picture, except that File System Redirected IO will be sent directly to NTFS, and we would never use Block Level Redirected IO. 
Counters Reference
In this section we will step through each counter and go into detail on specific counters. If you find this section too tedious to read then do not worry. You can skip over it and go directly to the scenario. This chapter will work for you as a reference.
Now let’s go through the performance counters in each of these groups starting from the counters with prefix IO. I want to remind you again that this group of counters tells you only about IOs that are sent to the CSV Volume Manager, and does NOT tell you how long IO spent inside CSVFS. It only measures how long it took for CSV Volume Manager and all components below it to complete the IO. For a disk it is unusual to see that some IO go Direct IO while other go Block Redirected IO. CSV Volume Manager always prefers Direct IO, and uses Block Redirected IO only if disk is not connected or if disk completes IO with an error. Normally either all IO are sent using Direct IO or Block Redirected IO. If you see a mix that might mean something wrong with path to the disk from this node.
IO
- IO Write Avg. Queue Length
- IO Read Avg. Queue Length
These two counters tell how many outstanding reads and writes we have on average per second. If we assume that all IOs are dispatched using Direct IO then value of this counter will be approximately equal to PhysicalDisk\Avg.Disk Write Queue Length and PhysicalDisk\Avg.Disk Read Queue Length accordingly. If IO is sent using Block Level Redirected IO then this counter will be reflecting SMB latency, which you can monitor using SMB Client Shares\Avg. Write Queue Length and SMB Client Shares\Avg. Read Queue Length.
- IO Write Queue Length
- IO Read Queue Length
These two counters tell how many outstanding reads and writes we have at the moment of sample. A reader might wonder why do we need average queue length as well as current queue length and when does he need to look at one versus the other. The only shortcoming with average counter is that it is updated on IO completion. Let’s assume you are using perfmon that by default samples performance counters every second. If you have an IO that is taking 1 minute then for 1 minute average queue length will be 0, and once IO completes for a second it will become 60, while queue length tells you the length of IO queue at the moment of the sample so it will be telling you 1 for all 60 samples during the minute this IO is in progress. On the other hand if IO are completing very fast (microseconds) then there is a high chance that at the moment of the sample IO queue length will be 0 because we just happened to sample at the time when there was no IOs. In that case average queue length would be much more meaningful. Reads and writes are usually completing in microseconds or milliseconds so in majority of cases you want to look at the average queue length.
- IO Writes/sec
- IO Reads/sec
Tells you how many read/write operations on average have completed in the past second. When all IO are sent using Direct IO then this value should be very close to PhysicalDisk\Disk Reads/sec and PhysicalDisk\Disk Writes/sec accordingly. If IO is sent using Block Level Redirected IO then counters value should be close to Smb Client Share\Write Requests/sec and Smb Client Share\ Read Requests/sec.
- IO Writes
- IO Reads
Tells you how many read/write operations have completed since the volume was mounted. Keep in mind that values of these counters will be reset every time file system dismounts and mounts again for instance when you offline/online corresponding cluster disk resource.
- IO Write Latency
- IO Read Latency
Tells you how many seconds read/write operations take on average. If you see a value 0.003 that means IO takes 3 milliseconds. When all IO are sent using Direct IO then this value should be very close to PhysicalDisk\Avg.Disk sec/Read and PhysicalDisk\Avg.Disk sec/Write accordingly. If IO are sent using Block Level Redirected IO then counters value should be close to Smb Client Share\Avg.sec/Write and Smb Client Share\Avg.sec/Read.
- IO Read Bytes/sec
- IO Read Bytes
- IO Write Bytes/sec
- IO Write Bytes
These counters are similar to the counters above, except that instead of telling you # of read and write operations (a.k.a IOPS) they are telling throughput measured in bytes.
- IO Split Reads/sec
- IO Split Reads
- IO Split Writes/sec
- IO Split Writes
These counters help you to monitor how often CSVFS needs to split IO to multiple IOs due to the disk fragmentation, when contiguous file offsets map to disjoined blocks on the disk. You can reduce fragmentation by running defrag. Please remember that to run defrag on CSVFS you need to put it to the File System Redirected mode so CSVFS would not disable block moves on NTFS. There is no straight answer to the question if a particular value of the counter is bad. Remember that this counter does not tell you how much fragmentation is on the disk. It only tells you how much fragmentation is being hit by ongoing IOs. For instance you might have all IOs going to couple locations on the disk that happened to be fragmented, and the rest of the volume is not fragmented. Should you worry then? It depends … if you are using SSDs then it might not matter, but if you are using HDDs then running defrag might improve throughput if it will make IO more sequential. Another common reason to run defrag is to consolidate free space so it can be trimmed. This is particularly important with SSDs or thinly provisioned disks. CSVFS IO Split performance counters would not help with monitoring free space fragmentation.
- IO Single Reads/sec
- IO Single Reads
- IO Single Writes/sec
- IO Single Writes
Last set of counters in that group tells you how many IO were dispatched without need to be split. It is a complement of the corresponding “IO Split” counters, and is not that interesting for performance monitoring.
Redirected
Next we will go through the performance counters with prefix Redirected. I want to remind you that this group of counters tells you only about IOs that are sent to NTFS directly (on Coordinating node) or over SMB (from a non-Coordinating node), and does NOT tell you how long IO spent inside CSVFS, but only measures how long it took for SMB/NTFS and all components below it to complete the IO.
- Redirected Writes Avg. Queue Length
- Redirected Reads Avg. Queue Length
These two counters tell how many outstanding reads and writes do we have on average per second. This counter will be reflecting SMB latency, which you can monitor using SMB Client Shares\Avg. Write Queue Length and SMB Client Shares\Avg. Read Queue Length.
- Redirected Write Queue Length
- Redirected Read Queue Length
These two counters tell how many outstanding reads and writes we have at the moment of sample. Please read comments for the IO Write Queue Length and IO Read Queue Length counters if you are wondering when you should look at average queue length versus the current queue length.
- Redirected Write Latency
- Redirected Read Latency
Tells you how many milliseconds read/write operations take on average. Counters value should be close to Smb Client Share\Avg.sec/Write and Smb Client Share\Avg.sec/Read.
- Redirected Read Bytes/sec
- Redirected Read Bytes
- Redirected Reads/sec
- Redirected Reads
- Redirected Write Bytes/sec
- Redirected Write Bytes
- Redirected Writes/sec
- Redirected Writes
These counters will help you to monitor IOPS and throughput, and do not require much explaining. Note that when CSVFS sends IO using FS Redirected IO it will never split IO on a fragmented files because it forwards IO to NTFS, and NTFS will perform translation of file offsets to the volume offsets and will split IO into multiple if required due to file fragmentation.
Volume
Next we will go through the performance counters with prefix Volume. For all the counters in this group please keep in mind that values start fresh from 0 every time CSVFS mounts. For instance offlining and onlining back corresponding cluster physical disk resource will reset the counters.
- Volume State
- Tells current CSVFS volume state. Volume might be in one of the following states.
- 0 - Init state. In that state all files are invalidated and all IOs except volume IOs are failing.
- 1 - Paused state. In this state volume will pause any new IO and down-level state is cleaned.
- 2 - Draining state. In this state volume will pause any new IO, but down-level files are still opened and some down-level IOs might be still in process.
- 3 - Set Down Level state. In this state volume will pause any new IO. The down-level state is already reapplied.
- 4 - Active state. In this state all IO are proceeding as normal.
- Down-level in the state descriptions above refer to the state that CSVFS has on the NTFS. Example of that state would be files opened by CSVFS on NTFS, byte range locks, file delete disposition, oplock states etc.
- Tells current CSVFS volume state. Volume might be in one of the following states.
- Volume Pause Count – Total
- Number of times volume was paused. This includes the number of times volume was paused because user told cluster to move corresponding physical disk resource from one cluster node to another. Or when customer turns volume redirection on and off.
- Volume Pause Count - Other
- Volume Pause Count - Network
- Volume Pause Count – Disk
- Number of time volume this node experienced network, disk or some other failure that caused CSVFS to pause all IO on the volume and go through the recovery circle.
Latency
And here comes the last set performance counters from CSVFS group. Counters in this group do not have a designated prefix. These counters are measuring IO at the time when it arrives to the CSVFS, and include all the time IO spent at any layers inside or below CSVFS.
- Write Queue Length
- Read Queue Length
These two counters tell how many outstanding reads and writes we have at the moment of sample.
- Write Latency
- Read Latency
These counters tell you how much time on average passes since IO has arrived to CSVFS before CSVFS completes this IO. It includes the time IO spends at any layer below CSVFS. Consequently it includes IO Write Latency, IO Read Latency, Redirected Write Latency and Redirected Read Latency depending on the type of IO and how IO was dispatched by the CSVFS.
- Writes/sec
- Reads/sec
- Writes
- Reads
These counters will help you monitor IOPS and throughput, and hopefully do not require much explaining.
- Flushes/sec
- Flushes
These counters tell you how many flushes come to CSVFS on all the file objects that are opened
- Files Opened
Tells how many files are currently opened on this CSV volume
- Files Invalidated - Other
- Files Invalidated - During Resume
CSVFS provides fault tolerance and attempts to hide various failures from application, but in some cases it might need to indicate that recovery was not successful. It does that by invalidating application’s file open and by failing all IOs issued on this open. These two counters allow you to see how many files opens were invalidated. Please note that invalidating open does not do anything bad to the file on the disk. It simply means that application will see IO failure and will need to reopen the file and reissue these IOs.
- Create File/sec
- Create File
Allows you to monitor how many file opens are happening on the volume.
- Metadata IO/sec
- Metadata IO
This is catch all for all other operations that are not covered by any counters above. This counters will be incremented when you query or set file information or issue an FSCTL on a file.
Performance Counter Relationships
To better understand relationship between different groups of CSVFS performance counters lets go through lifetime of some hypothetical non-cached write operation.
- A non-cached write comes to CSVFS
- CSVFS increments Write Queue Length
- CSVFS remembers the timestamp when IO has arrived.
- Let’s assume CSVFS decides that it can perform Direct IO on the file and it dispatches the IO to the CSV Volume Manager.
- CSVFS increments IO Write Queue Length
- CSVFS remembers the timestamp when IO was forwarded to the volume manager
- Let’s assume IO fails because something has happened to the disk and CSV Volume Manager is not able to deal with that. CSVFS will pause this IO and will go through recovery.
- CSVFS decrements IO Write Queue Length
- CSVFS take timestamp of completion, subtracts the timestamp we took in step 2.ii. This tells us how long CSV Volume manager took to complete this IO. Using this value CSVFS update IO Write Avg. Queue Length and IO Write Latency
- CSVFS increments IO Writes and IO Writes/sec counter
- Depending if this write had to be split due to file fragmentation CSVFS increments either IO Single Writes and IO Single Writes/sec or IO Split Writes and IO Split Writes/sec.
- Once CSVFS recovered it will reissue the paused write. Let’s assume that this time CSVFS finds that it has to dispatch IO using File System Redirected IO
- CSVFS increments Redirected Write Queue Length
- CSVFS remembers the timestamp when IO was forwarded to NTFS directly or over SMB
- Let’s assume SMB completes write successfully
- CSVFS decrements Redirected Write Queue Length
- CSVFS take timestamp of completion, subtracts the timestamp we took in step 4.ii. This tells us how long SMB and NTFS took to complete this IO. Using this value CSVFS update Redirected Writes Avg. Queue Length and Redirected Write Latency
- CSVFS increments Redirected Write and Redirected Write/sec counters.
- If necessary CSVFS will do any post-processing after the IO completion and finally will complete the IO
- CSVFS decrements Write Queue Length
- CSVFS take timestamp of completion, subtracts the timestamp we took in step 1.ii. This tells us how long CSVFS took to complete this IO. Using this value CSVFS updates Write Latency
- CSVFS increments Writes and Writes/sec counters.
Note the color highlighting in the sample above. It is emphasizing relationship of the performance counter groups. We can also describe this scenario using following diagram where you can see how time ranges are included 
CSV volume pause is a very rear event and very few IOs run into it. For majority of IOs timeline would look in one of the following ways 
In these cases Read Latency and Write Latency will be the same as IO Read Latency, IO Write Latency, Redirected Read Latency and Redirected Write Latency depending on the IO type and how it was dispatched.
In some cases file system might hold an IO. For instance if IO extends a file then it will be serialized with other extending IO on the same file. In that case timeline might looks like this 
The important point here is that Read Latency and Write Latency are expected to be slightly larger than its IO* and Redirected* partner counters.
Cluster CSV Volume Manager
One thing that we cannot tell using CSVFS performance counters is if IO was sent using Direct IO or Block Level Redirected IO. This is because CSVFS does not have that information as it happens at a lower layer, only CSV Volume Manager knows that. You can get visibility to what is going on in the CSV volume manger using Cluster CSV Volume Manager counter set.
Performance counters in this group can be split into 2 categories. The first category has Redirected in its name and second does not. All the counters that do NOT have Redirected in the name are describing what is going on with Direct IO, and all the counters that do describe Block Level Redirected IO. Most of the counters are self-explanatory. Two require some explaining. If disk is connected then CSV Volume Manager always first attempts to send IO directly to the disk. If disk fails the IO the CSV Volume Manger will increment Direct IO Failure Redirection and Direct IO Failure Redirection/sec and will retry this IO using Block Level Redirected IO path over SMB. So these two counters help you to tell if IO is redirected because disk is not physically connected or because disk is failing IO for some reason. 
Common Scenarios
In this section we will go over the common scenario/question that can be answered using performance counters.
Disclaimer: Please do not read much into the actual values of the counters in the samples below because samples were taken on test machines that are backed by extremely slow storage and on the machines with bunch of debugging features enabled. These samples are here to help you to understand relationship between counters.
Is direct IO is happening?
Simply check IOPS and throughput using following CSV Volume Manager counters
- \Cluster CSV Volume Manager(*)\IO Reads/sec
- \Cluster CSV Volume Manager(*)\IO Writes/sec
- \Cluster CSV Volume Manager(*)\IO Read-Bytes/sec
- \Cluster CSV Volume Manager(*)\IO Write-Bytes/sec
Values should be approximately equal to the load that you are placing on the volume.
You can also verify that no unexpected redirected IO is happening by checking IOPs and throughput on the CSV File System Redirected IO path using CSVFS performance counters
- \Cluster CSV File System(*)\Redirected Reads/sec
- \Cluster CSV File System(*)\Redirected Writes/sec
- \Cluster CSV File System(*)\Redirected Read Bytes/sec
- \Cluster CSV File System(*)\Redirected Write Bytes/sec
and CSV Volume Redirected IO path
- \Cluster CSV Volume Manager(*)\IO Reads/sec - Redirected
- \Cluster CSV Volume Manager(*)\IO Writes/sec - Redirected
- \Cluster CSV Volume Manager(*)\IO Read-Bytes/sec - Redirected
- \Cluster CSV Volume Manager(*)\IO Write-Bytes/sec – Redirected

Above is an example of how Performance Monitor would look like on the Coordinator node when all IO is going using Direct IO. You can see that \Cluster CSV File System(*)\Redirected* counters are all 0 as well as \Cluster CSV Colume Manager(*)\* - Redirected performance counters are 0. This tells us that there is no File System Redirected IO or Block level Redirected IO.
What is total IOPS and throughput?
You can check how much over all IO is going through a CSV volume using following CSVFS performance counters
- \Cluster CSV File System(*)\Reads/sec
- \Cluster CSV File System(*)\Writes/sec
Value of the counters above will be equal to the sum of IO going to the File System Redirected IO path
- \Cluster CSV File System(*)\Redirected Reads/sec
- \Cluster CSV File System(*)\Redirected Writes/sec
- \Cluster CSV File System(*)\Redirected Read Bytes/sec
- \Cluster CSV File System(*)\Redirected Write Bytes/sec
and IO going to the CSV Volume Manager, which volume manager might dispatch using Direct IO or Block Redirected IO
- \Cluster CSV File System(*)\IO Reads/sec
- \Cluster CSV File System(*)\IO Writes/sec
- \Cluster CSV File System(*)\IO Read Bytes/sec
- \Cluster CSV File System(*)\IO Write Bytes/sec
What is Direct IO IOPs and throughput?
You can check how much IO is sent by the CSV volume manager directly to the disk connected on the cluster node using following performance counters
- \Cluster CSV Volume Manager(*)\IO Reads/sec
- \Cluster CSV Volume Manager(*)\IO Writes/sec
- \Cluster CSV Volume Manager(*)\IO Read-Bytes/sec
- \Cluster CSV Volume Manager(*)\IO Write-Bytes/sec
Value of these counters will be approximately equal to the values of the following performance counters of the corresponding physical disk
- \PhysicalDisk(*)\Disk Reads/sec
- \PhysicalDisk(*)\Disk Writes/sec
- \PhysicalDisk(*)\Disk Read Bytes/sec
- \PhysicalDisk(*)\Disk Write Bytess/sec
What is File System Redirected IOPS and throughput?
You can check how much IO is sent by the CSVFS directly to the disk connected on the cluster node using following performance counters
- \Cluster CSV File System(*)\Redirected Reads/sec
- \Cluster CSV File System(*)\Redirected Writes/sec
- \Cluster CSV File System(*)\Redirected Read Bytes/sec
- \Cluster CSV File System(*)\Redirected Write Bytes/sec

The picture above shows you what you would see on the coordinating node if you put Volume1 in the File System Redirected mode. You can see that only \Cluster CSV File System(*)\Redirected* are changing while \Cluster CSV File System(*)\IO* are all 0. Since File system redirected IO does not go through the CSV Volume manager its counters stay 0. File System Redirected IO go to NTFS, and NTFS sends this IO to the disk so you can see Physical Disk counters match to the CSV File System Redirected IO counters.
What is Block Level Redirected IOPs and throughput?
You can check how much IO CSV Volume Manager dispatches directly to the Coordinating node using SMB using following performance counters.
- \Cluster CSV Volume Manager(*)\IO Reads/sec - Redirected
- \Cluster CSV Volume Manager(*)\IO Writes/sec - Redirected
- \Cluster CSV Volume Manager(*)\IO Read-Bytes/sec - Redirected
- \Cluster CSV Volume Manager(*)\IO Write-Bytes/sec – Redirected
Please note that since on the Coordinating node disk is always present CSV will always use Direct IO, and will never use Block Redirected IO so on the Coordinating node values of these counters should stay 0.
What is average Direct IO and Block Level Redirected IO latency?
To find out Direct IO latency you need to look at the counters
- \Cluster CSV File System(*)\IO Read Latency
- \Cluster CSV File System(*)\IO Write Latency
To understand where this latency is coming from you need to first look at the following CSV Volume Manager performance counters to see if IO is going Direct IO or Block Redirected IO
- \Cluster CSV Volume Manager(*)\IO Reads/sec
- \Cluster CSV Volume Manager(*)\IO Writes/sec
- \Cluster CSV Volume Manager(*)\IO Reads/sec - Redirected
- \Cluster CSV Volume Manager(*)\IO Writes/sec – Redirected
If IO goes to Direct IO then next compare CSVFS latency to the latency reported by the disk
- \PhysicalDisk(*)\Avg. Disk sec/Read
- \PhysicalDisk(*)\Avg. Disk sec/Write
If IO goes to Block Redirected Direct IO, and you are on Coordinator node then you still need to look at the Physical Disk performance counters. If you are on non-Coordinator node then compare look at the latency reported by SMB on the CSV$ share using following counters
- \SMB Client Shares(*)\Avg sec/Write
- \SMB Client Shares(*)\Avg sec/Read
Then compare SMB client latency to the Physical disk latency on the coordinator node.
Below you can see a sample where all IO goes Direct IO path and latency reported by the physical disk matches to the latency reported by the CSVFS, which means the disk is the only source of the latency and CSVFS does not add on top of it. 
What is File System Redirected IO latency?
To find out File System Redirect IO latency you need to look at the counters
- \Cluster CSV File System(*)\Redirected Read Latency
- \Cluster CSV File System(*)\Redirected Write Latency
To find out where this latency is coming from on coordinator node compare it to the latency reported by the physical disk.
- \PhysicalDisk(*)\Avg. Disk sec/Read
- \PhysicalDisk(*)\Avg. Disk sec/Write
If you see latency reported by the physical disk is much lower to what reported by the physical disk then one of the components located between CSVFS and the disk is enquing/serializing the IO. 
Above you can see an example where you can see physical disk reported latency
- \Cluster CSV File System(*)\Write Latency is 19 milliseconds
- \Cluster CSV File System(*)\Redirected Write Latency is 19 milliseconds
- \PhysicalDisk(*)\Avg. Disk sec/Write is 18 milliseconds
- \Cluster CSV File System(*)\Read Latency is 24 milliseconds
- \Cluster CSV File System(*)\Redirected Read Latency is 23 milliseconds
- \PhysicalDisk(*)\Avg. Disk sec/Read is 23 milliseconds
Given statistical errors ant that snapshotting values of different counters is not synchronized we can ignore 1 milliseconds that CSVFS adds and we can say that most of the latency comes from the physical disk.
If you are on non-Coordinating node then you need to look at SMB Client Share performance counters for the volume share
- \SMB Client Shares(*)\Avg sec/Write
- \SMB Client Shares(*)\Avg sec/Read
After that look at the latency reported by the physical disk on the Coordinator node to see how much latency is coming from SMB itself 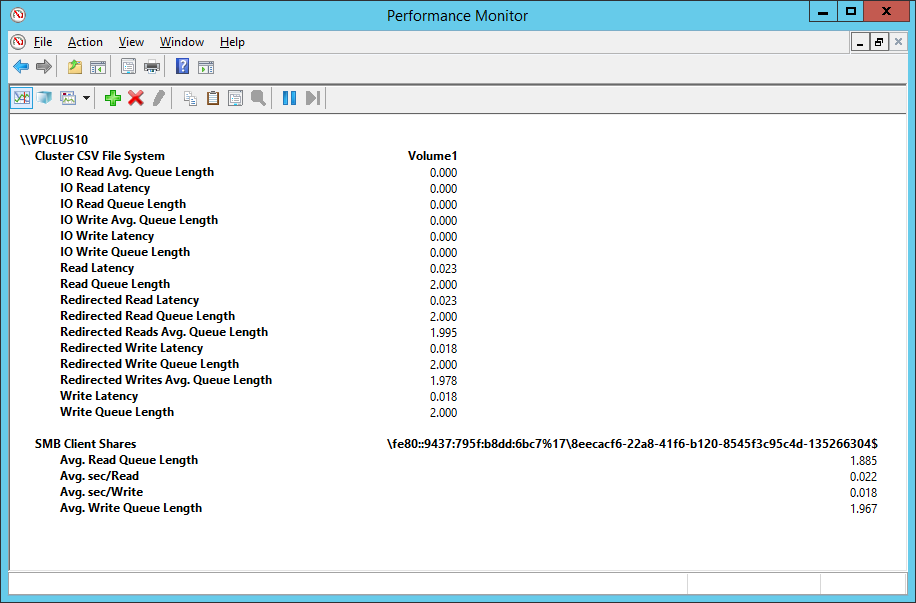
In the sample above you can see
- \Cluster CSV File System(*)\Write Latency is 18 milliseconds
- \Cluster CSV File System(*)\Redirected Write Latency is 18 milliseconds
- \SMB Client Shares(*)\Avg sec/Write is 18 milliseconds
- \Cluster CSV File System(*)\Read Latency is 23 milliseconds
- \Cluster CSV File System(*)\Redirected Read Latency is 23 milliseconds
- \SMB Client Shares(*)\Avg sec/Read is 22 milliseconds
In the sample before we’ve seen that disk read latency is 23 milliseconds and write latency is 18 milliseconds so we can conclude that disk is the biggest source of latency.
Is my disk the bottleneck?
To answer this question you need to look at the sum/average of the following performance counters across all cluster nodes that perform IO on this disk. Each node’s counters will tell you how much IO is done by this node, and you will need to do the math to find out the aggregate values.
- \PhysicalDisk(*)\Avg. Disk Read Queue Length
- \PhysicalDisk(*)\Avg. Disk Write Queue Length
- \PhysicalDisk(*)\Avg. Disk sec/Read
- \PhysicalDisk(*)\Avg. Disk sec/Write
You can play with different queue length changing load of the disk and checking against your target. There is really no right or wrong answer here and it all depends on what is your application expectations are. 
In the sample above you can see that total IO queue length on the disk is about (8.951+8.538+10.336+10.5) 38.3, and average latency is about ((0.153+0.146+0.121+0.116)/4) 134 milliseconds.
Please note that physical disk number in this sample happens to be the same – 7 on both cluster nodes. You should not assume it will be the same. On the coordinator node you can find it using Cluster Administrator UI by looking at the Disk Number column. 
Unfortunately there are no good tools to find it on the non-Coordinator node, the Disk Management mmc snap-in is the best tool.
To find physical disk number on all cluster nodes you can move the Cluster Disk from node to node writing down Disk Number on each node, but be careful especially when you have actual workload running because while moving volume CSV will pause all IOs, which will impact your workload throughput.
Is my network the bottleneck?
When you are looking at the cluster networks keep in mind that cluster splits networks into several categories and each type of traffic uses only some of the categories. You can read more about that in the following blog post http://blogs.msdn.com/b/clustering/archive/2011/06/17/10176338.aspx .
If you know the network bandwidth you can always do math to verify that it is large enough to be able to handle your load. But you should verify it in empirical way then before you put your cluster into production. I would suggest you use following steps:
- Online disk on the cluster node and stress/saturate your disks by putting lots of non-cached IO on the disk. Monitor IOPS, and MBPS on the disk using PhysicalDisk performance counters
- \PhysicalDisk(*)\Disk Reads/sec
- \PhysicalDisk(*)\Disk Writes/sec
- \PhysicalDisk(*)\Disk Read Bytes/sec
- \PhysicalDisk(*)\Disk Write Bytes/sec
- From another cluster node run the same test over SMB, and now monitor SMB Client Share performance counters
- \SMB Client Shares(*)\Write Bytes/Sec
- \SMB Client Shares(*)\Read Bytes/Sec
- \SMB Client Shares(*)\Writes/Sec
- \SMB Client Shares(*)\Reads/Sec
If you see that you are getting the same IOPS and MBPS then your bottleneck is the disk, and network is fine.
In case if you are using Scale-out File Server (SOFS) you can use similar way to verify that network is not the bottleneck, but in this case instead of PhysicalDisk counters use Cluster CSV File System performance counters
- \Cluster CSV File System(*)\Reads/sec
- \Cluster CSV File System(*)\Writes/sec
When using RDMA it is a good idea to verify that RDMA is actually working by looking at the \SMB Direct Connection(*)\* family of counters.
Performance Counters Summary
We went over 4 counter sets that are most useful when investigating CSVFS performance. Using PowerShell cmdlets we are able to see if Direct IO is possible. Using performance counters we can verify if IO is indeed is going according to our expectations, and by looking at counters at different layers we can find where the bottleneck is.
Remember that none of the performance counters that we talked about is aggregated across multiple cluster nodes, each of them provides one node view.
If you want to automate collection of performance counters from multiple node consider using this simple script http://blogs.msdn.com/b/clustering/archive/2009/10/30/9915526.aspx that is just a convenience wrapper around logman.exe. It is described in the following blog post http://blogs.msdn.com/b/clustering/archive/2009/11/10/9919999.aspx .
Thanks!
Vladimir Petter
Principal Software Development Engineer
Clustering & High-Availability
Microsoft
To learn more, here are others in the Cluster Shared Volume (CSV) blog series:
Cluster Shared Volume (CSV) Inside Out
http://blogs.msdn.com/b/clustering/archive/2013/12/02/10473247.aspx
Cluster Shared Volume Diagnostics
http://blogs.msdn.com/b/clustering/archive/2014/03/13/10507826.aspx
Cluster Shared Volume Performance Counters
http://blogs.msdn.com/b/clustering/archive/2014/06/05/10531462.aspx
Cluster Shared Volume Failure Handling
http://blogs.msdn.com/b/clustering/archive/2014/10/27/10567706.aspx
You must be a registered user to add a comment. If you've already registered, sign in. Otherwise, register and sign in.